ADB’s FCAS
and SIDS Portfolio:
Benchmarking
Progress

A.Monitoring Results in
FCAS and SIDS
The FSA includes a results framework with indicators and an action plan as part of its monitoring. Monitoring results in FCAS-classified DMCs and SIDS fall broadly into three categories:
- (i)
portfolio information, including the size and composition of active and committed projects under implementation in FCAS and SIDS;
- (ii)
corporate results framework indicators, which are related to ADB operations and performance in FCAS and SIDS; and
- (iii)
The FSA Action Tracker, which monitors the progress of activities under the FSA Action Plan, 2021–2025.
ADB collects relevant data for the three categories through its portfolio and results databases, client and staff surveys, and administrative data. These data are disaggregated for FCAS and SIDS to pave the way for analytical work.
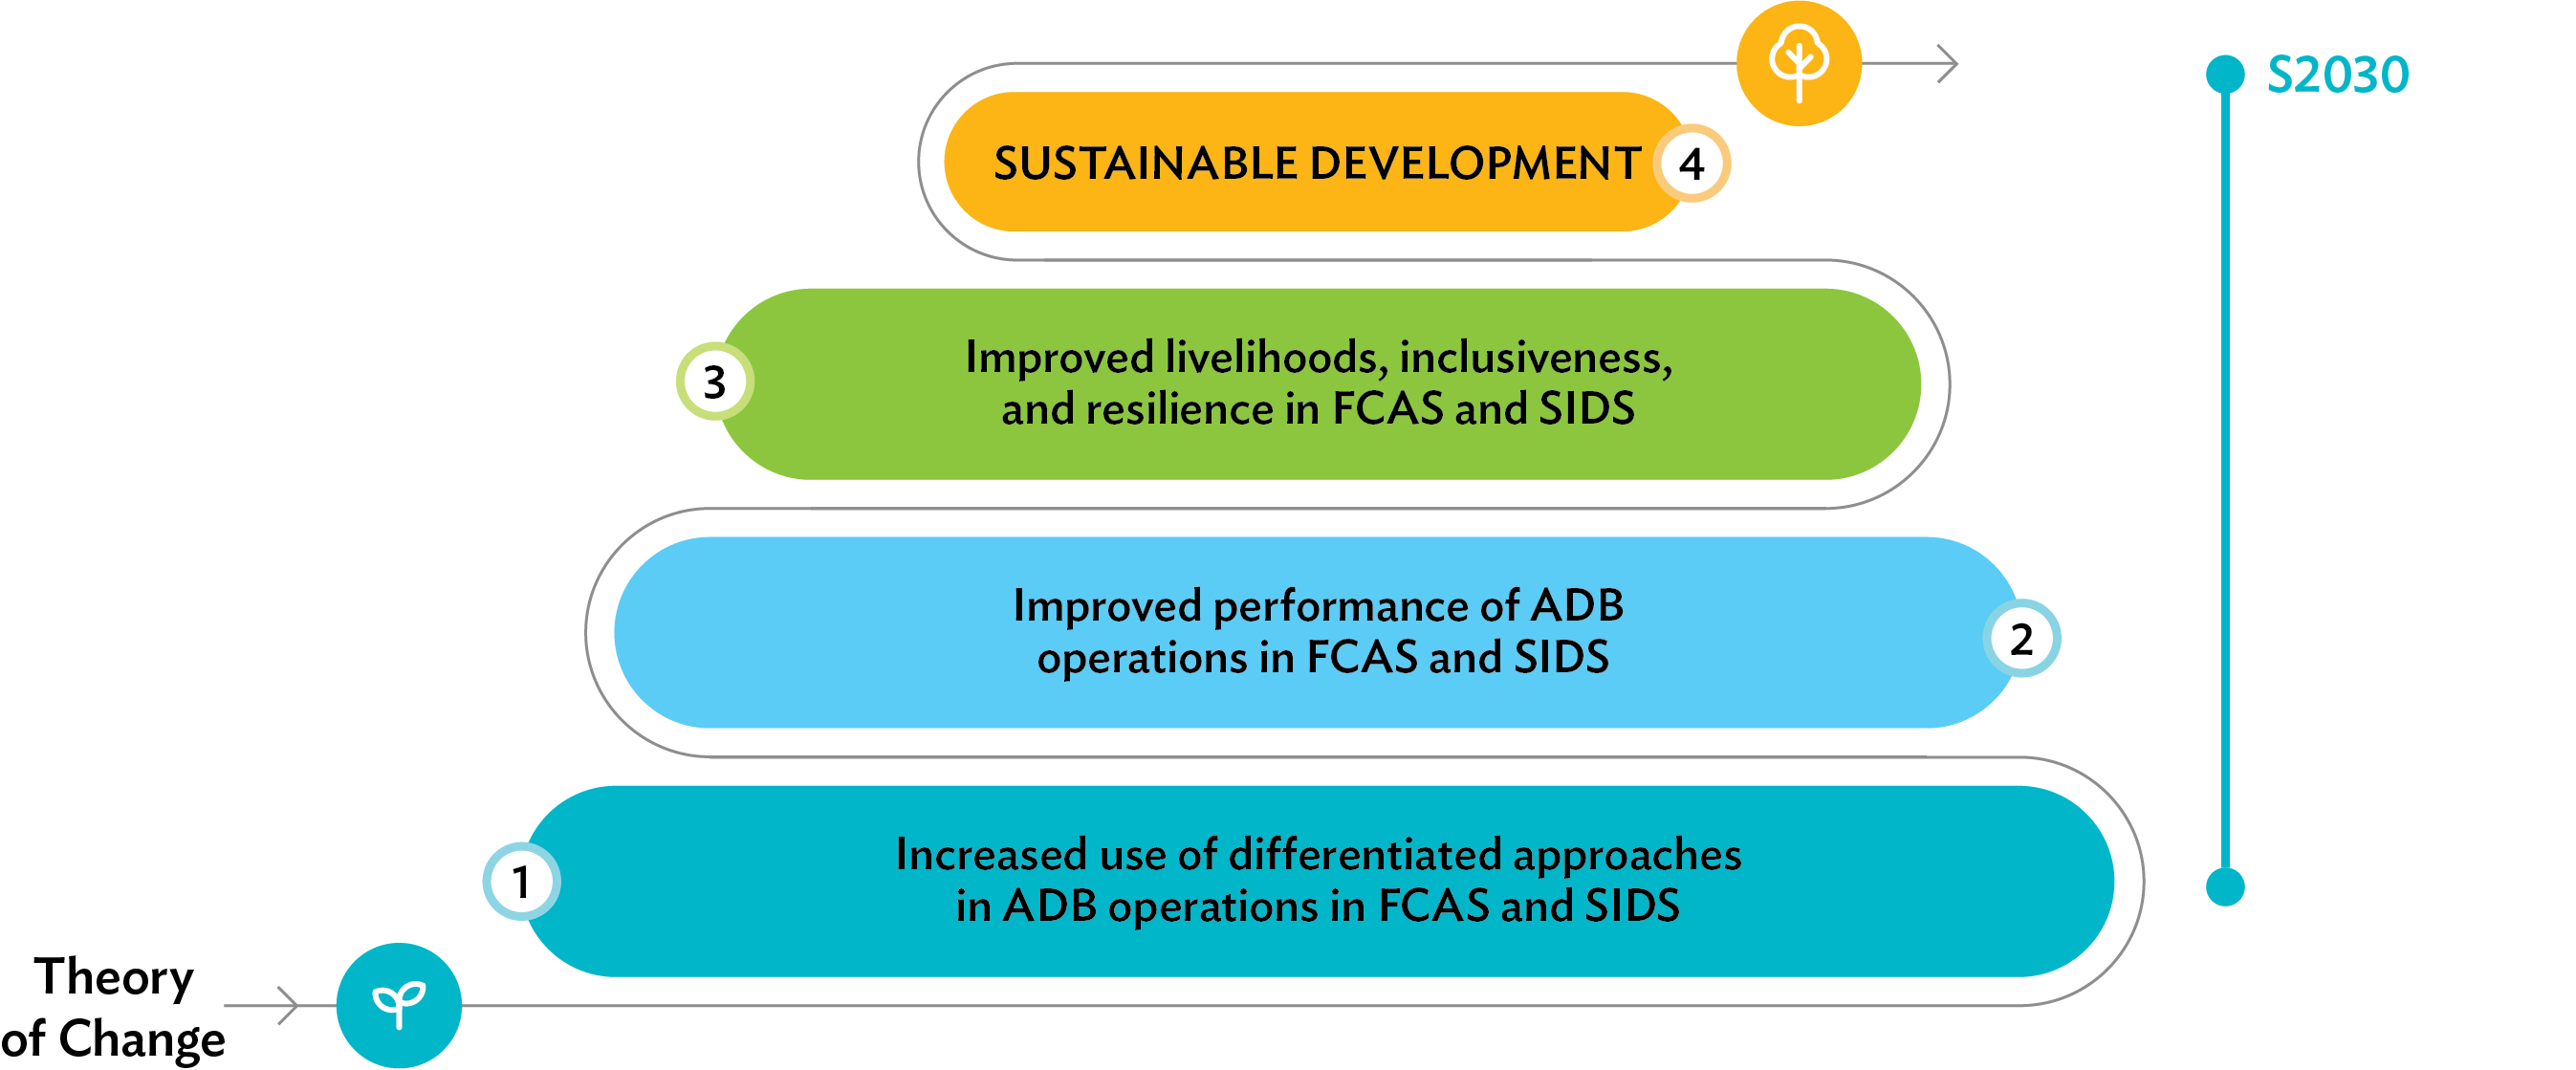
The theory of change underpinning the FSA holds that increased use of differentiated approaches should improve the performance of ADB operations in FCAS and SIDS, which in turn supports better development outcomes and broader sustainable development (Figure 2 ). Sufficient time will be
required—perhaps as long as 5–7 years, or about one full project cycle—for this change process to play out and be reflected in the FCAS and SIDS portfolio.
Approach Theory of Change
This report presents the most recent results for portfolio information and results indicators as of the end of 2024. Meanwhile, Appendix 1 presents progress against the FSA Action Plan, 2021–2025, comprising 14 key action areas and 36 supporting sub-actions under three pillars:
- (i)
Pillar 1: Improving responsiveness of standard ADB processes, procedures, and practices for FCAS and SIDS differentiated approaches;
- (ii)
Pillar 2: Increasing ADB’s institutional capacity for operations in FCAS and SIDS;
- (iii)
Pillar 3: Enhancing understanding of DMC contexts.
B.Results Framework
Indicators
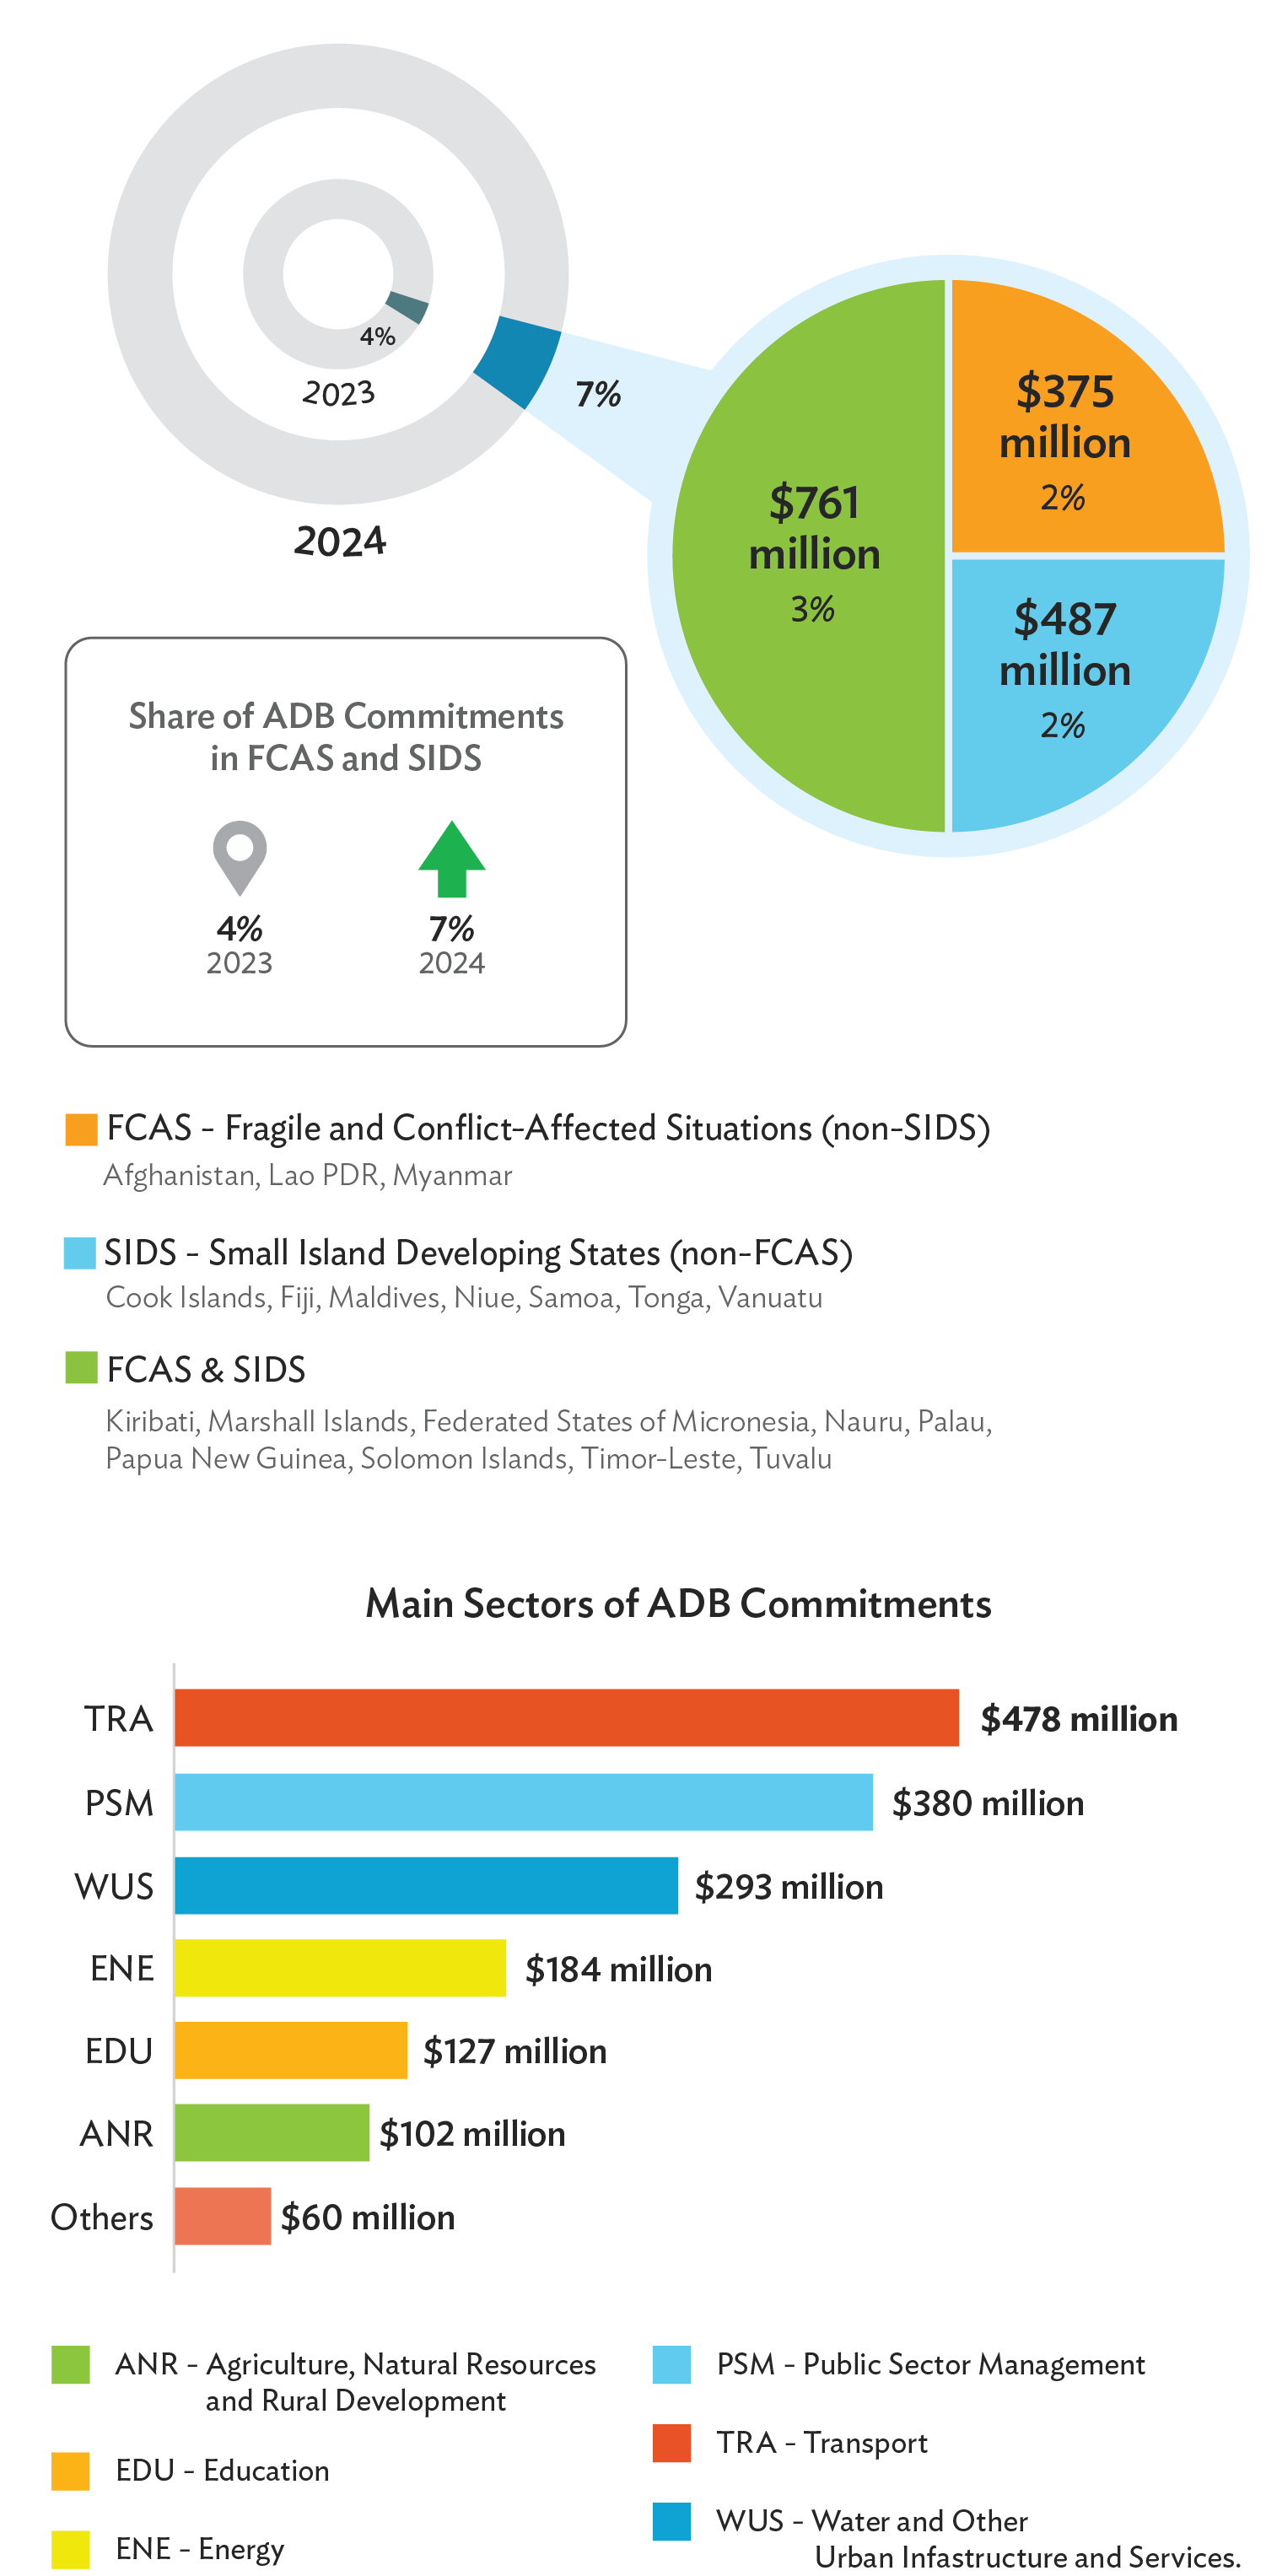
1.Commitments in FCAS and SIDS
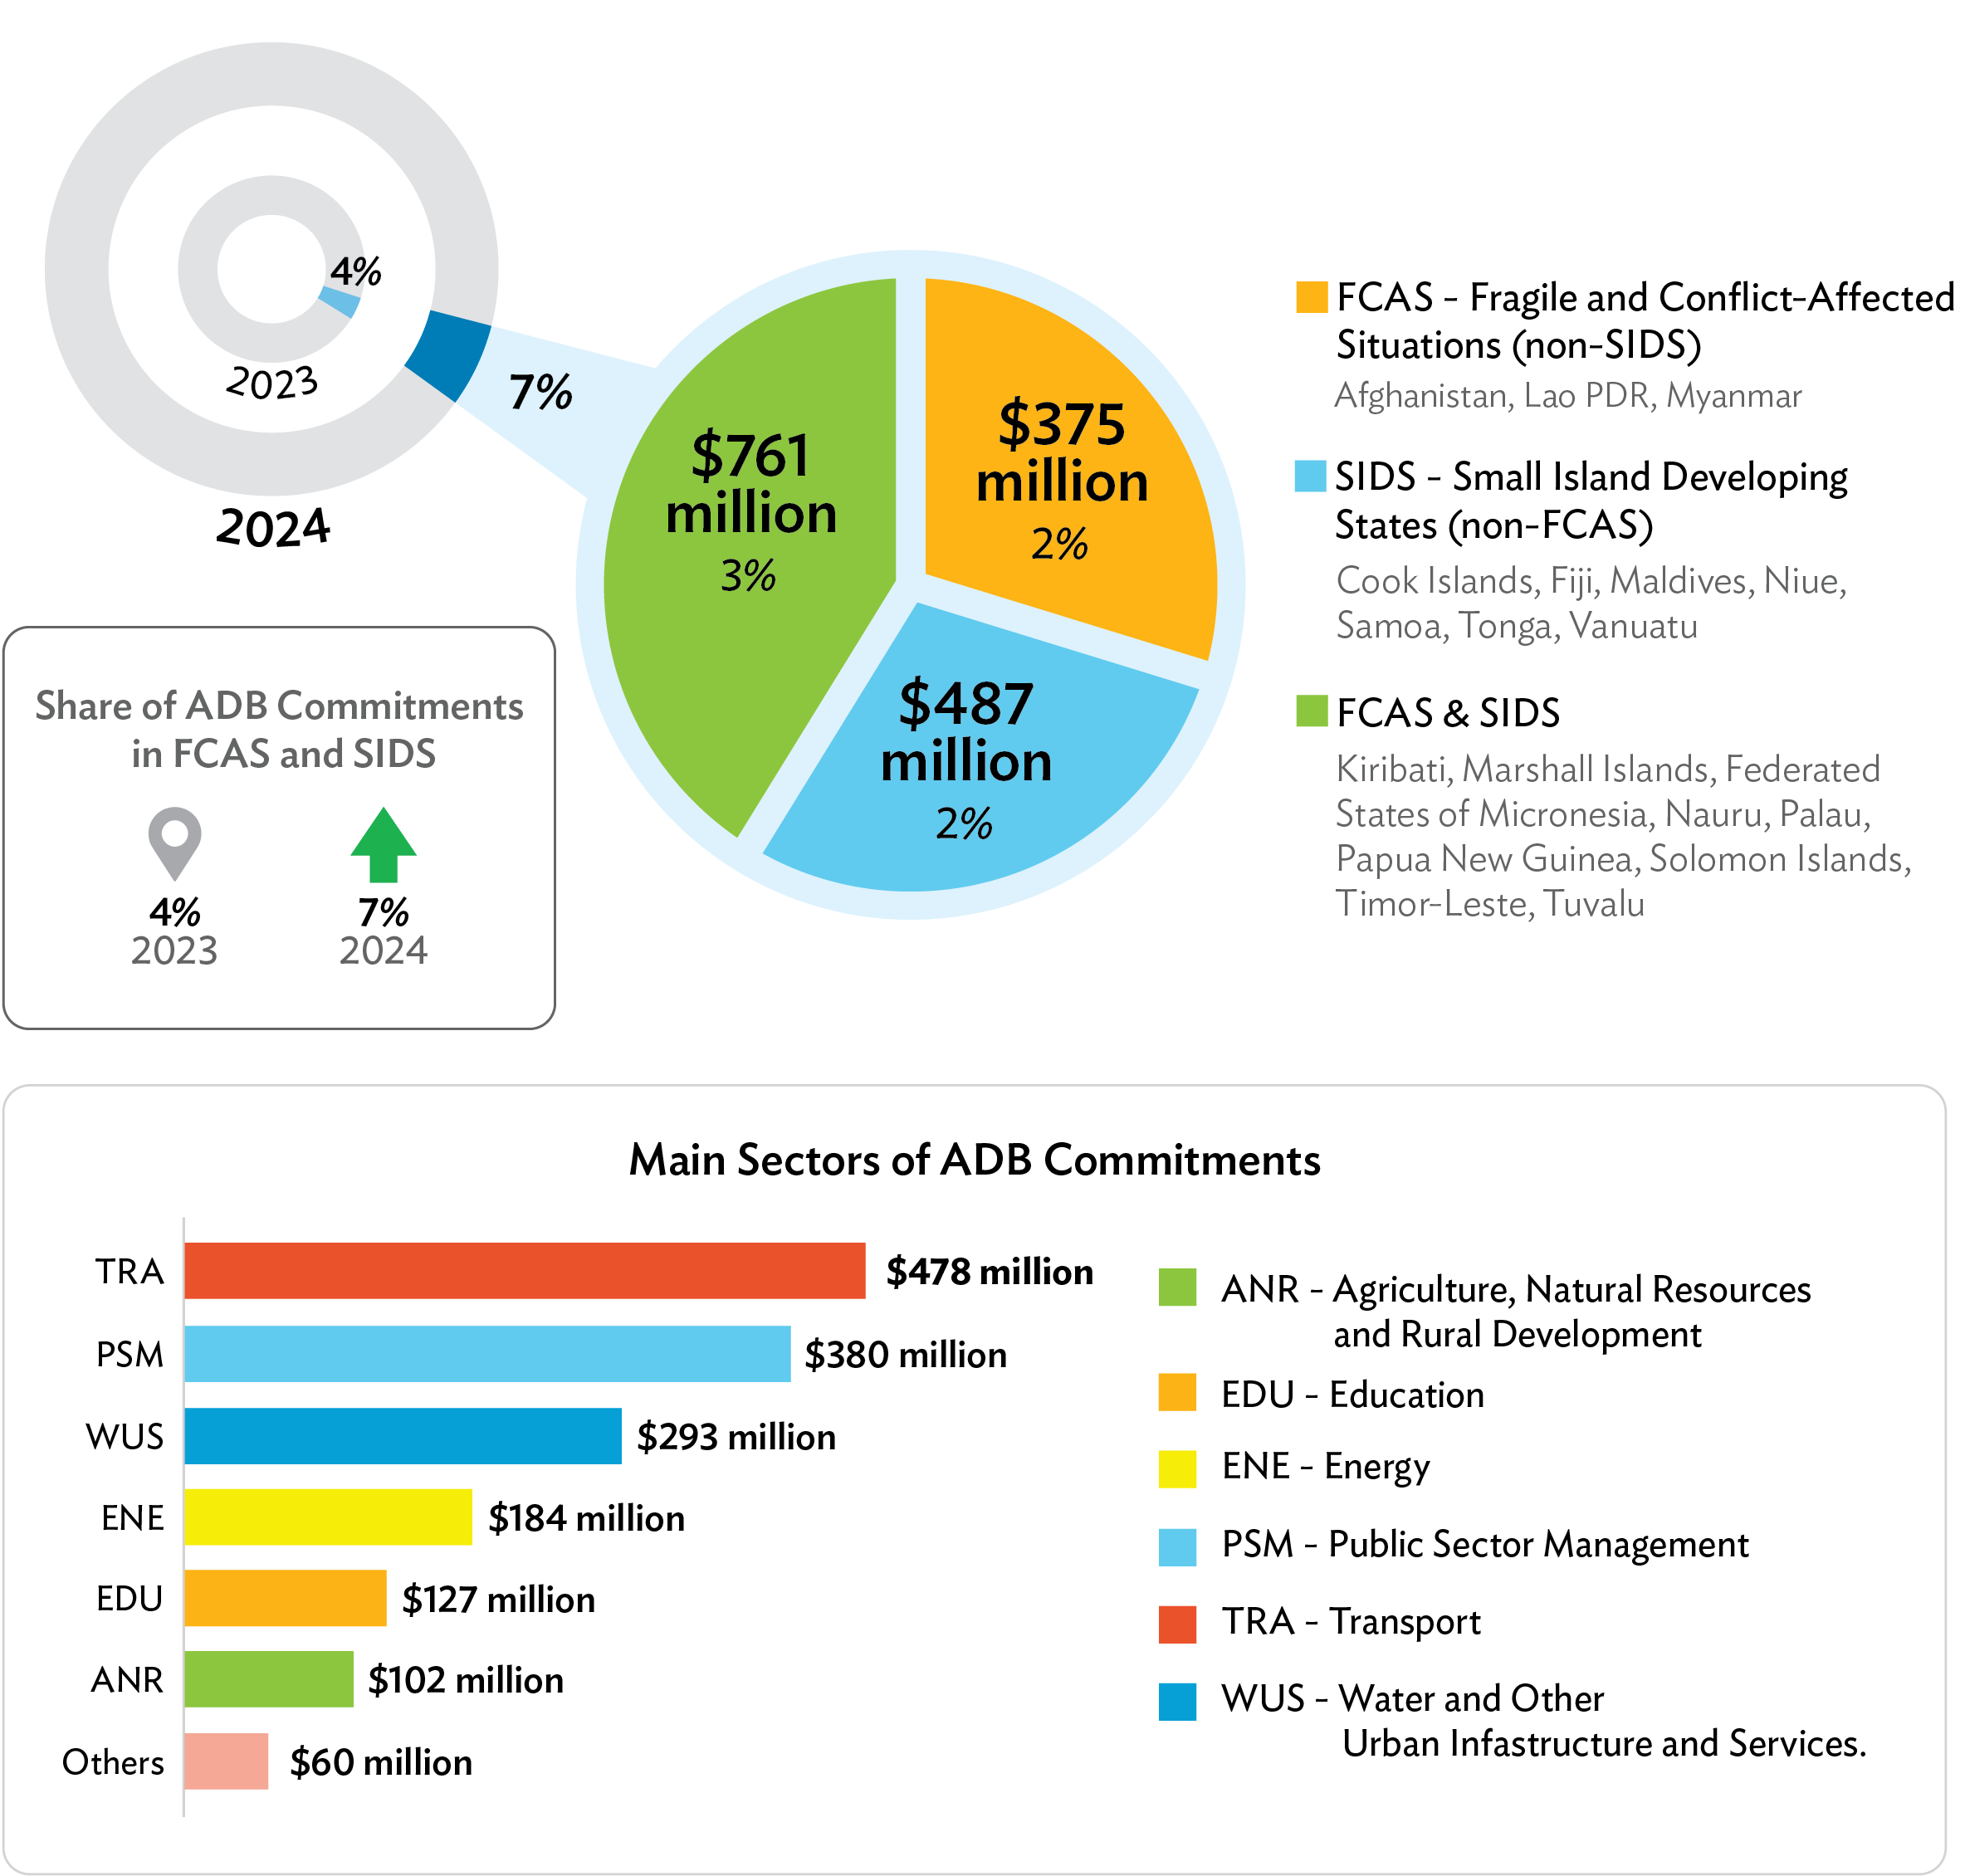
Commitments in FCAS and SIDS grew notably in 2024. ADB committed $1.6 billion to FCAS-classified DMCs and SIDS, a 75% increase from the $930 million committed in 2023. Correspondingly, the share of commitments to FCAS-classified DMCs and SIDS as a percentage of ADB’s total commitments grew from 4% to 7%. The increase in commitments was mainly driven by concessional ordinary capital resources lending (COL) increasing from $103.5 million in 2023 to $611.9 million in 2024, and ordinary capital resources (OCR) lending increasing from $148.9 million in 2023 to $326.4 million in 2024. The level of funding to FCAS and SIDS from the Asian Development Fund (ADF) was more or less maintained, with $685.1 million in 2024 compared with $677.7 million in 2023. 11 Commitments were mainly in transport ($478 million); public sector management ($380 million); water and other urban infrastructure and services (WUS) ($293 million); energy ($184 million); education ($127 million); and agriculture, natural resources, and rural development (ANR) ($102 million) (Figure 3). The largest increases were in transport and WUS. In transport, the average commitment per project was $119.5 million in 2024, compared with $46.6 million during 2022–2023. In WUS, the average commitment per project was $36.7 million in 2024, compared with $30.1 million during 2022–2023.
2.Performance of Completed
Sovereign Operations
A.Success Rates of
Completed Operations
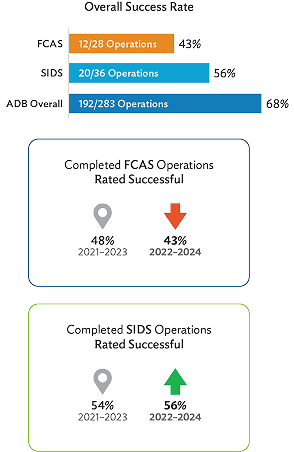
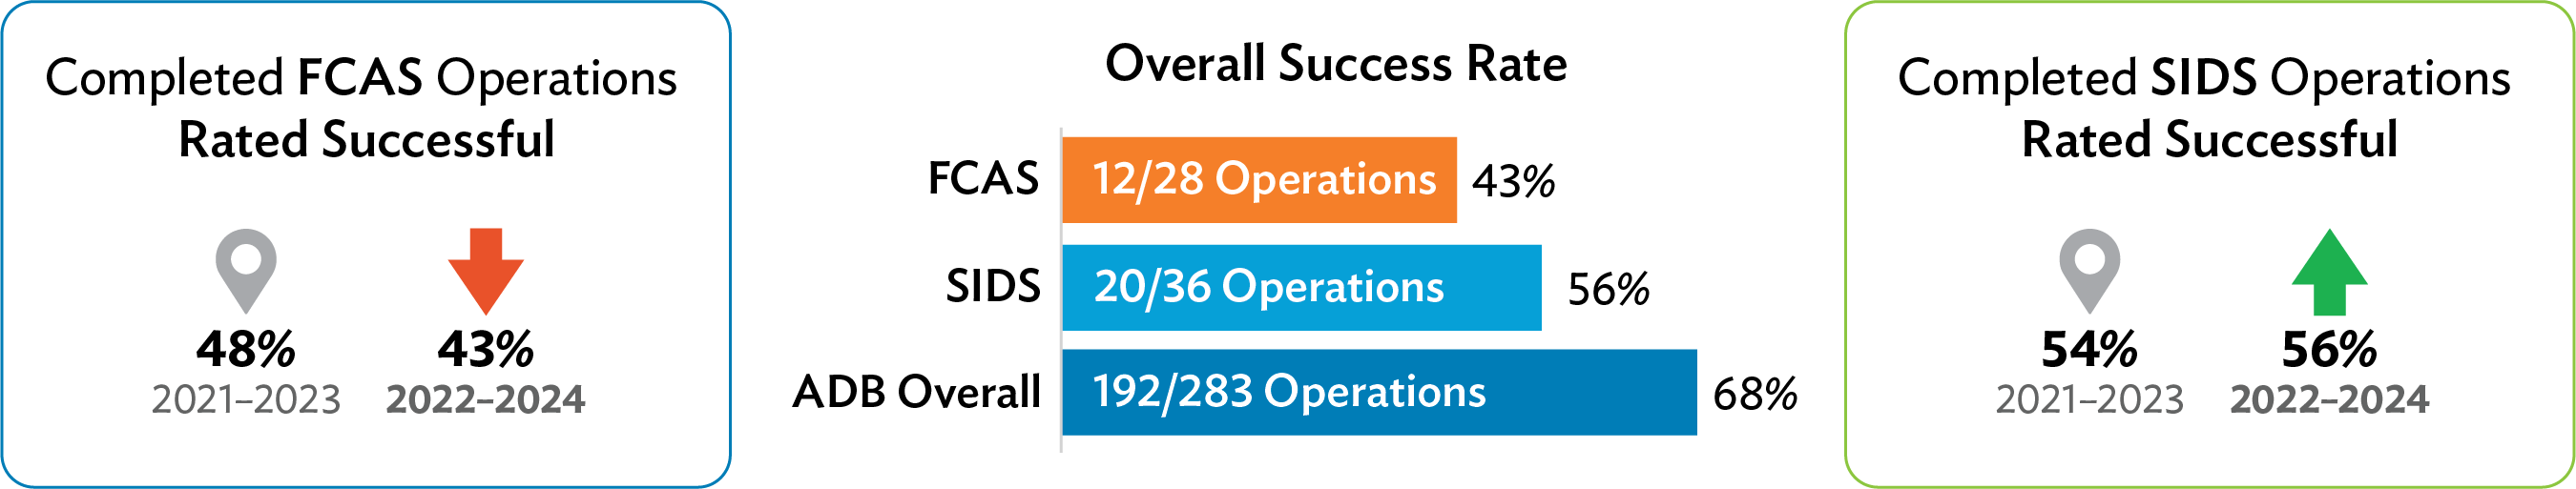
The success rate of completed operations in FCAS-classified DMCs declined to 43% in 2022–2024 (12 of 28 operations rated successful) from 48% in 2021–2023 (14 of 29 operations rated successful). 12
Meanwhile, the success rate of completed operations in SIDS improved to 56% in 2022–2024 (20 of 36 operations rated successful) from 54% in 2021–2023 (20 of 37 operations rated successful) (Figure 4). 13
- 1.
For the purpose of comparability, the 2020 FCAS classification is used throughout the duration of the current corporate results framework
- 2.
Updated success rates for the period 2021–2023 include completed COVID-19 Pandemic Response Option (CPRO) projects.
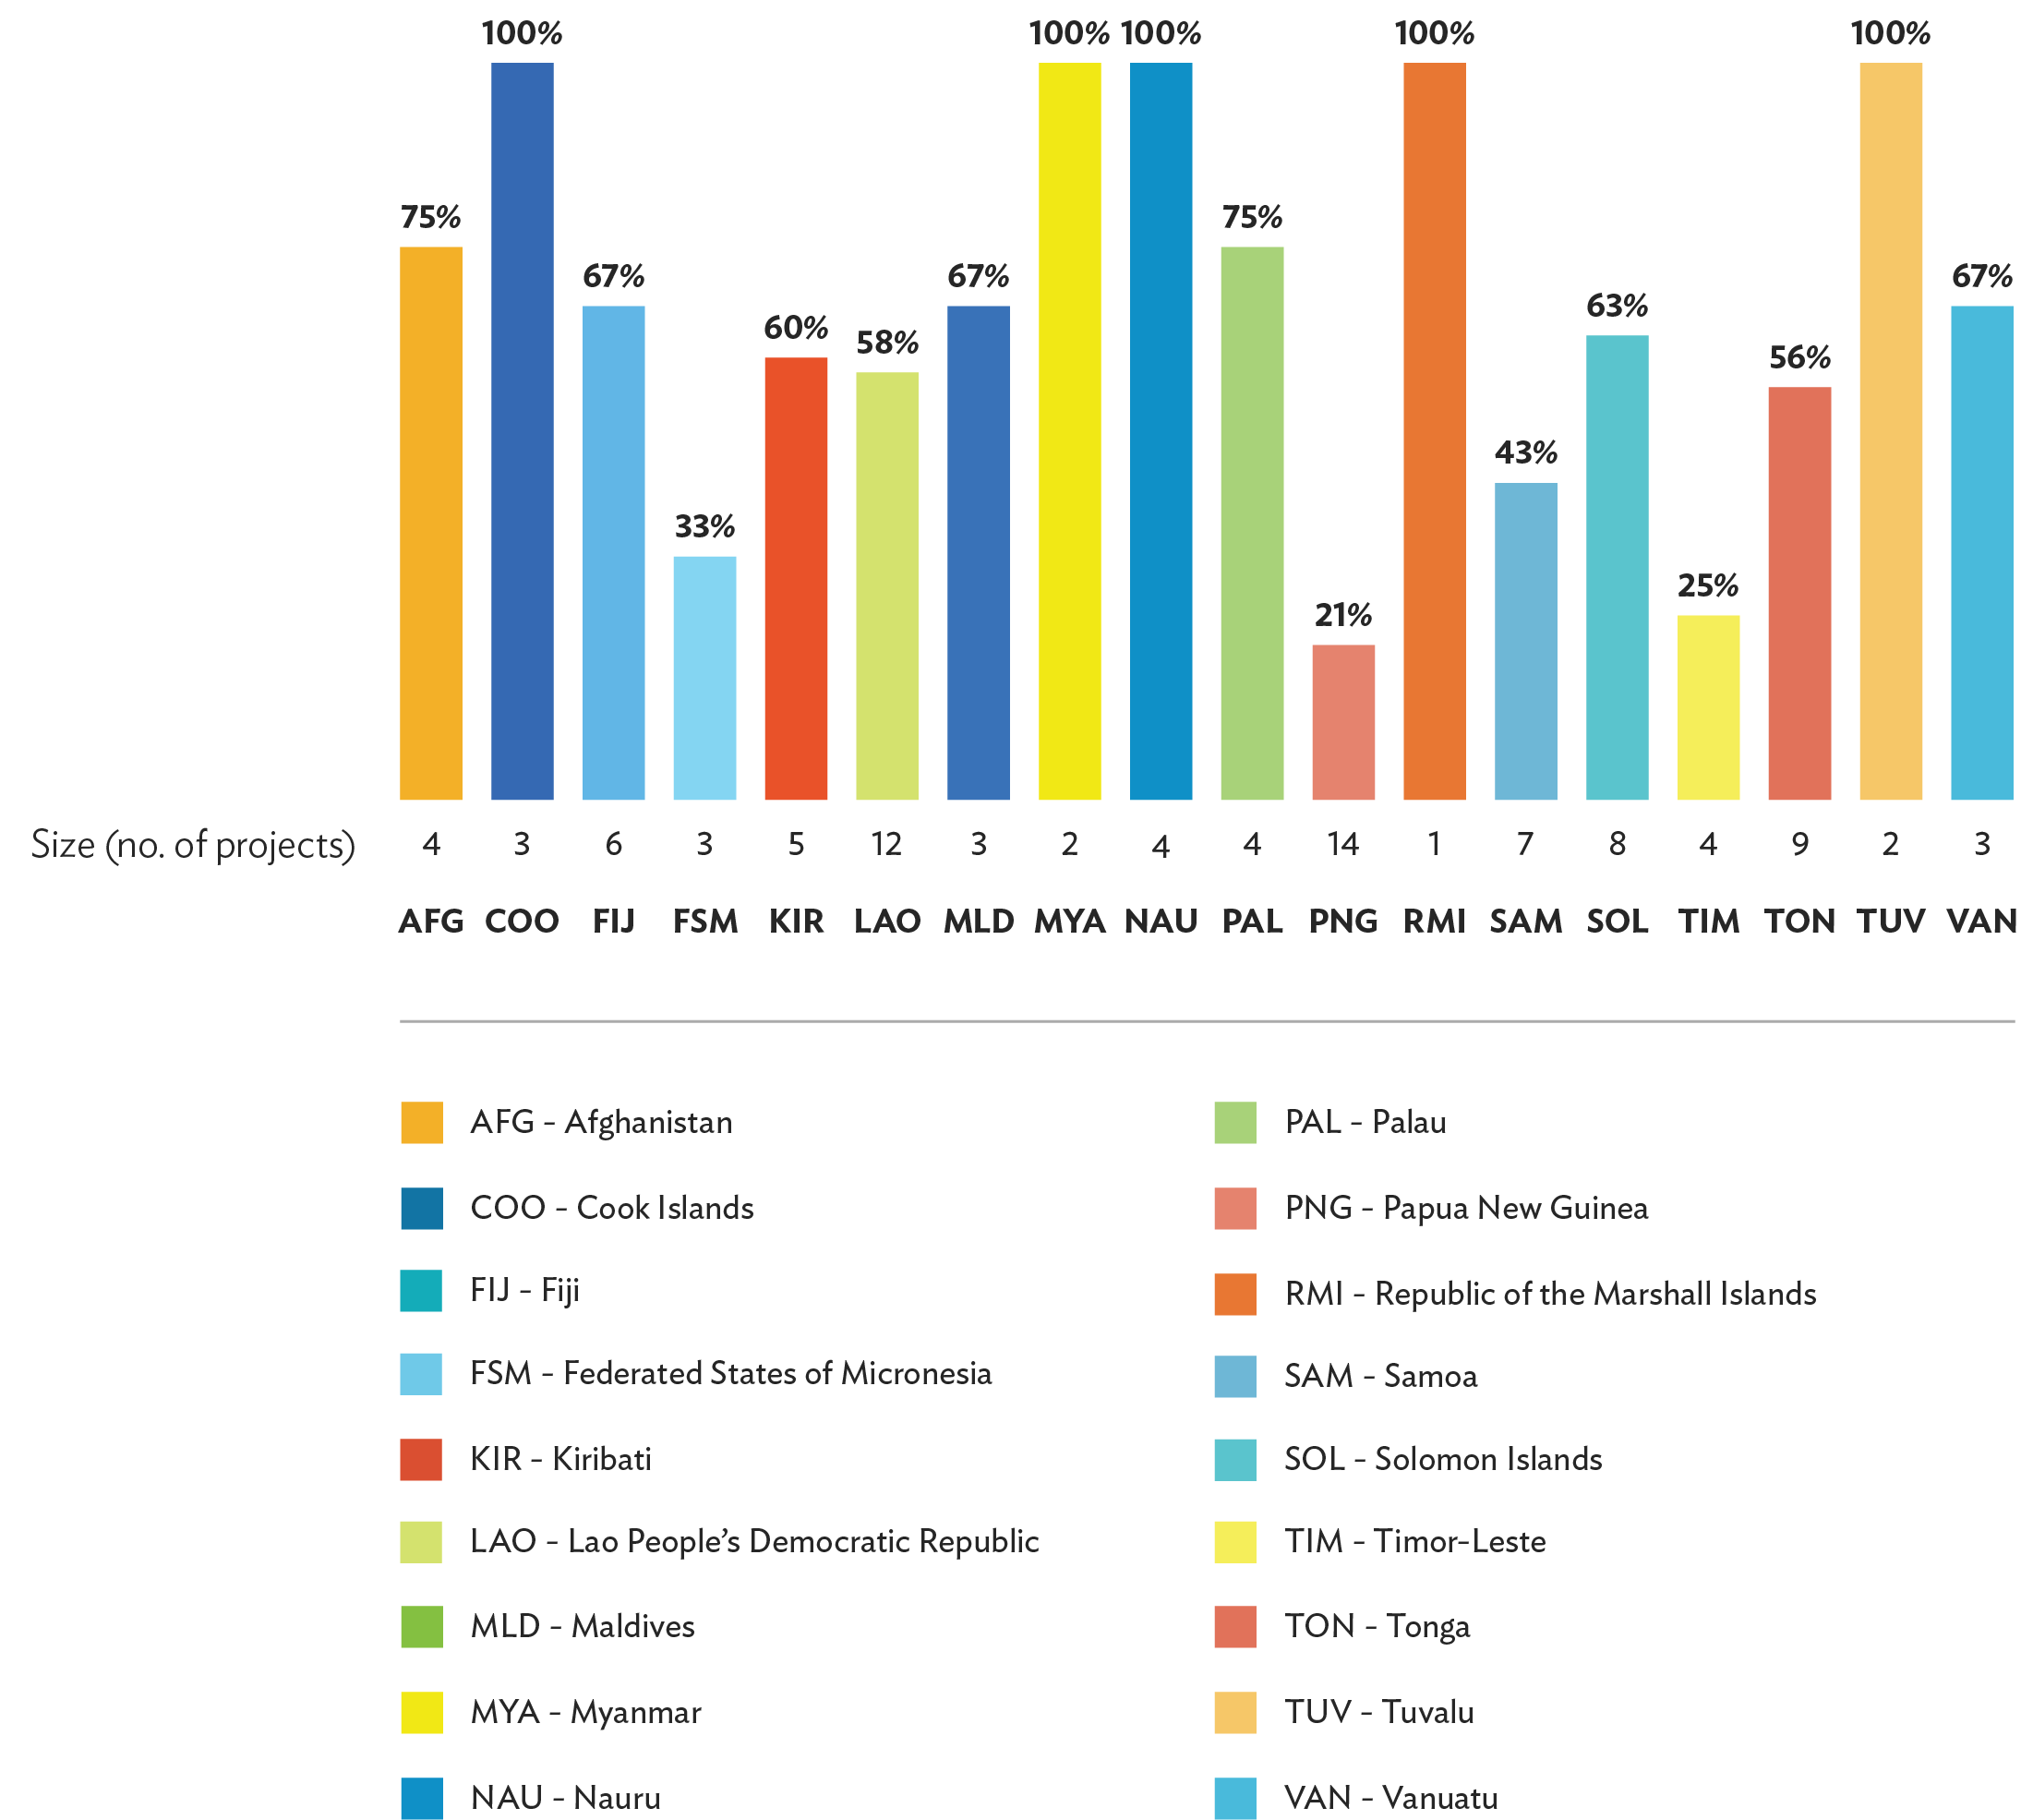
Success rates by country, 2016–2024. Annual success rates of completed projects by country are highly volatile because of the relatively small number of completed operations in FCAS-classified DMCs and SIDS; thus, it is more useful to consider success rates over a longer period. Looking at completed operations in FCAS and SIDS from 2016 to 2024, 14 12 DMCs had success rates of 60% or higher (Figure 5). The DMCs with the lowest success rates were Samoa (43%), the Federated States of Micronesia (33%), Timor-Leste (25%), and Papua New Guinea (PNG) (21%). Not only did PNG have the lowest success rate, but it also had the greatest number of projects. Completed operations in PNG totaled $1.4 billion, of which $1.0 billion (72%) were from infrastructure sectors (i.e., energy and transport).
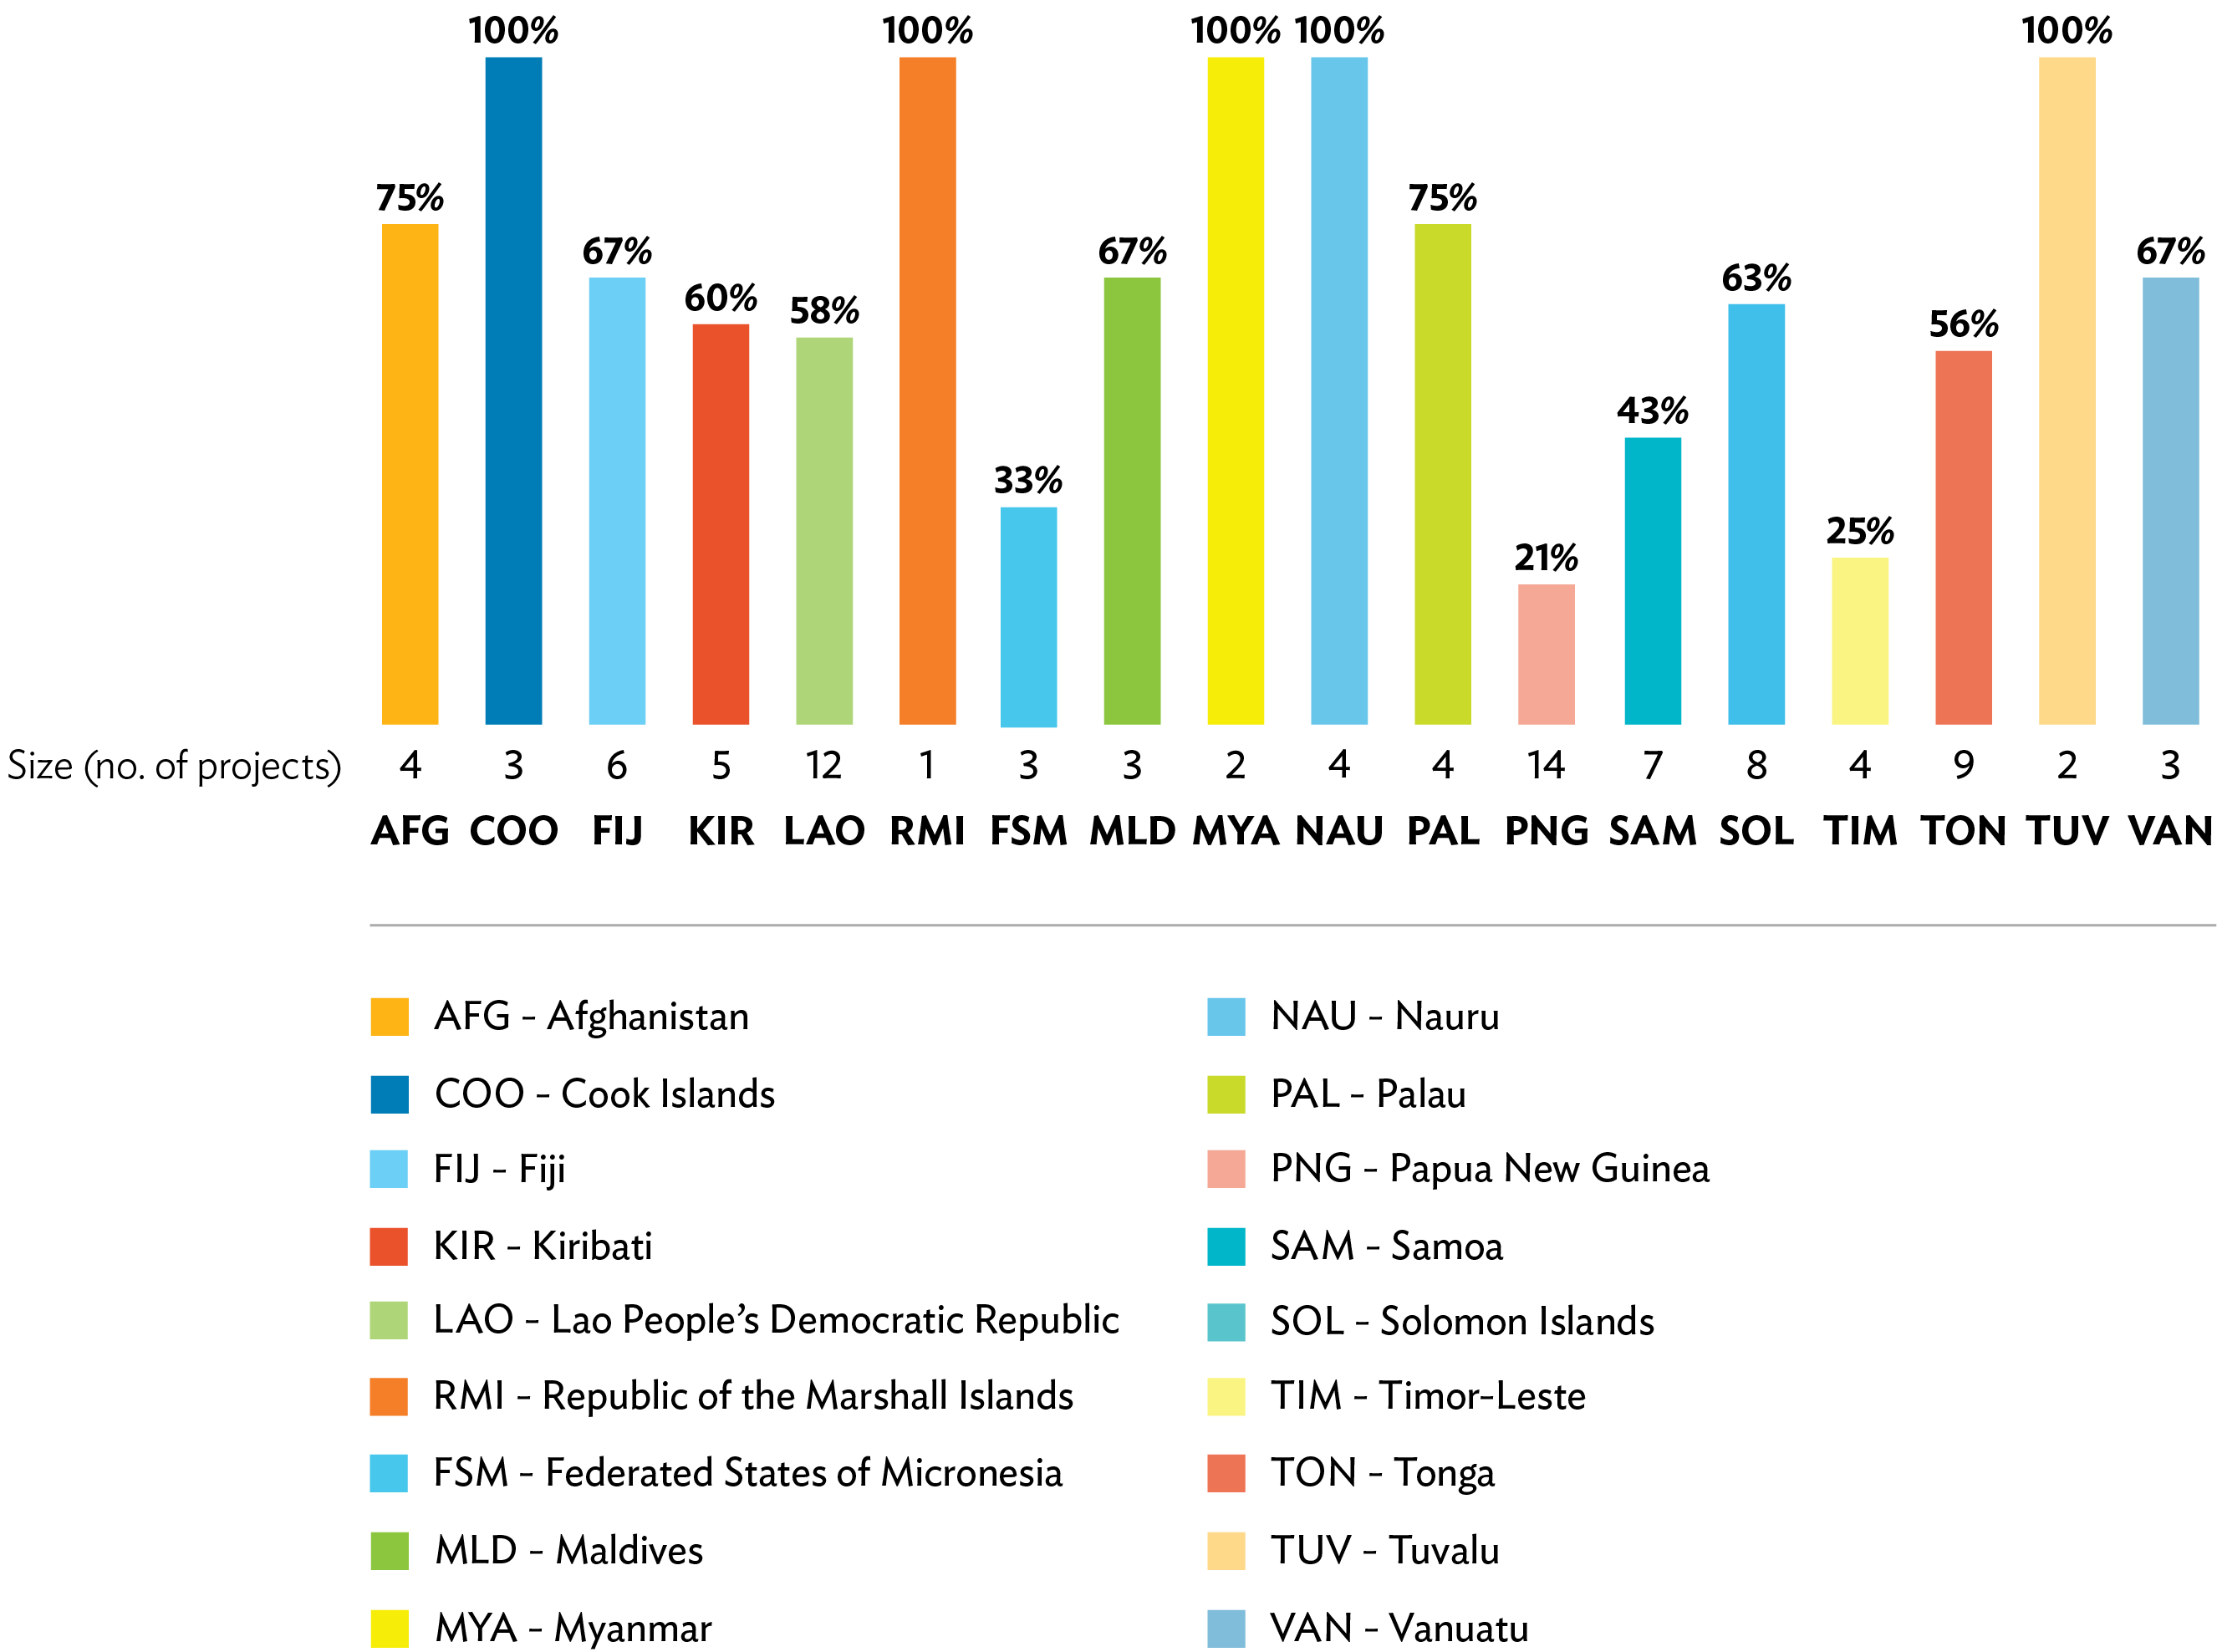
- 1.
Success rates for FCAS and SIDS have been combined because of the small number of projects. Inclusive of the baseline, 2016–2024 represents the period covered by the existing Corporate Results Framework (2019–2024).
- 2.
Niue is excluded from the figure because ADB did not complete any projects in Niue during 2016–2024.
Success rates by sector. During 2016–2024, five sectors had success rates of 67% or higher (Figure 6 ). Meanwhile, the sectors with the lowest success rates were energy (56%), information and communication technology (33%), transport (29%), and WUS (20%). Energy, transport, and WUS each had at least 10 projects during the period while having the lowest success rates.
B.Lessons from Completed Operations
Below are summaries of lessons from project teams and recommendations of ADB’s Independent Evaluation Department based on project validation reports of completed operations in FCAS and SIDS from 2016 to 2024.
Keys to success. Completed projects in FCAS and SIDS rated successful in 2024 exhibited several common threads. Successful projects tended to engage the government and local communities early in the planning process to understand their needs, which helped in tailoring project design while also fostering strong community ownership. They were supported by sound results chains with clearly linked outcome and output indicators. Constraints identified during project preparation were addressed in project design, leading to the achievement of the indicators. Project processing, approval, and implementation were completed without delay. Finally, successful FCAS and SIDS projects were backed by strong government commitment to sustaining project benefits. 15
Figure 6: Completed Operations Rated Successful by Sector, 2016–2024
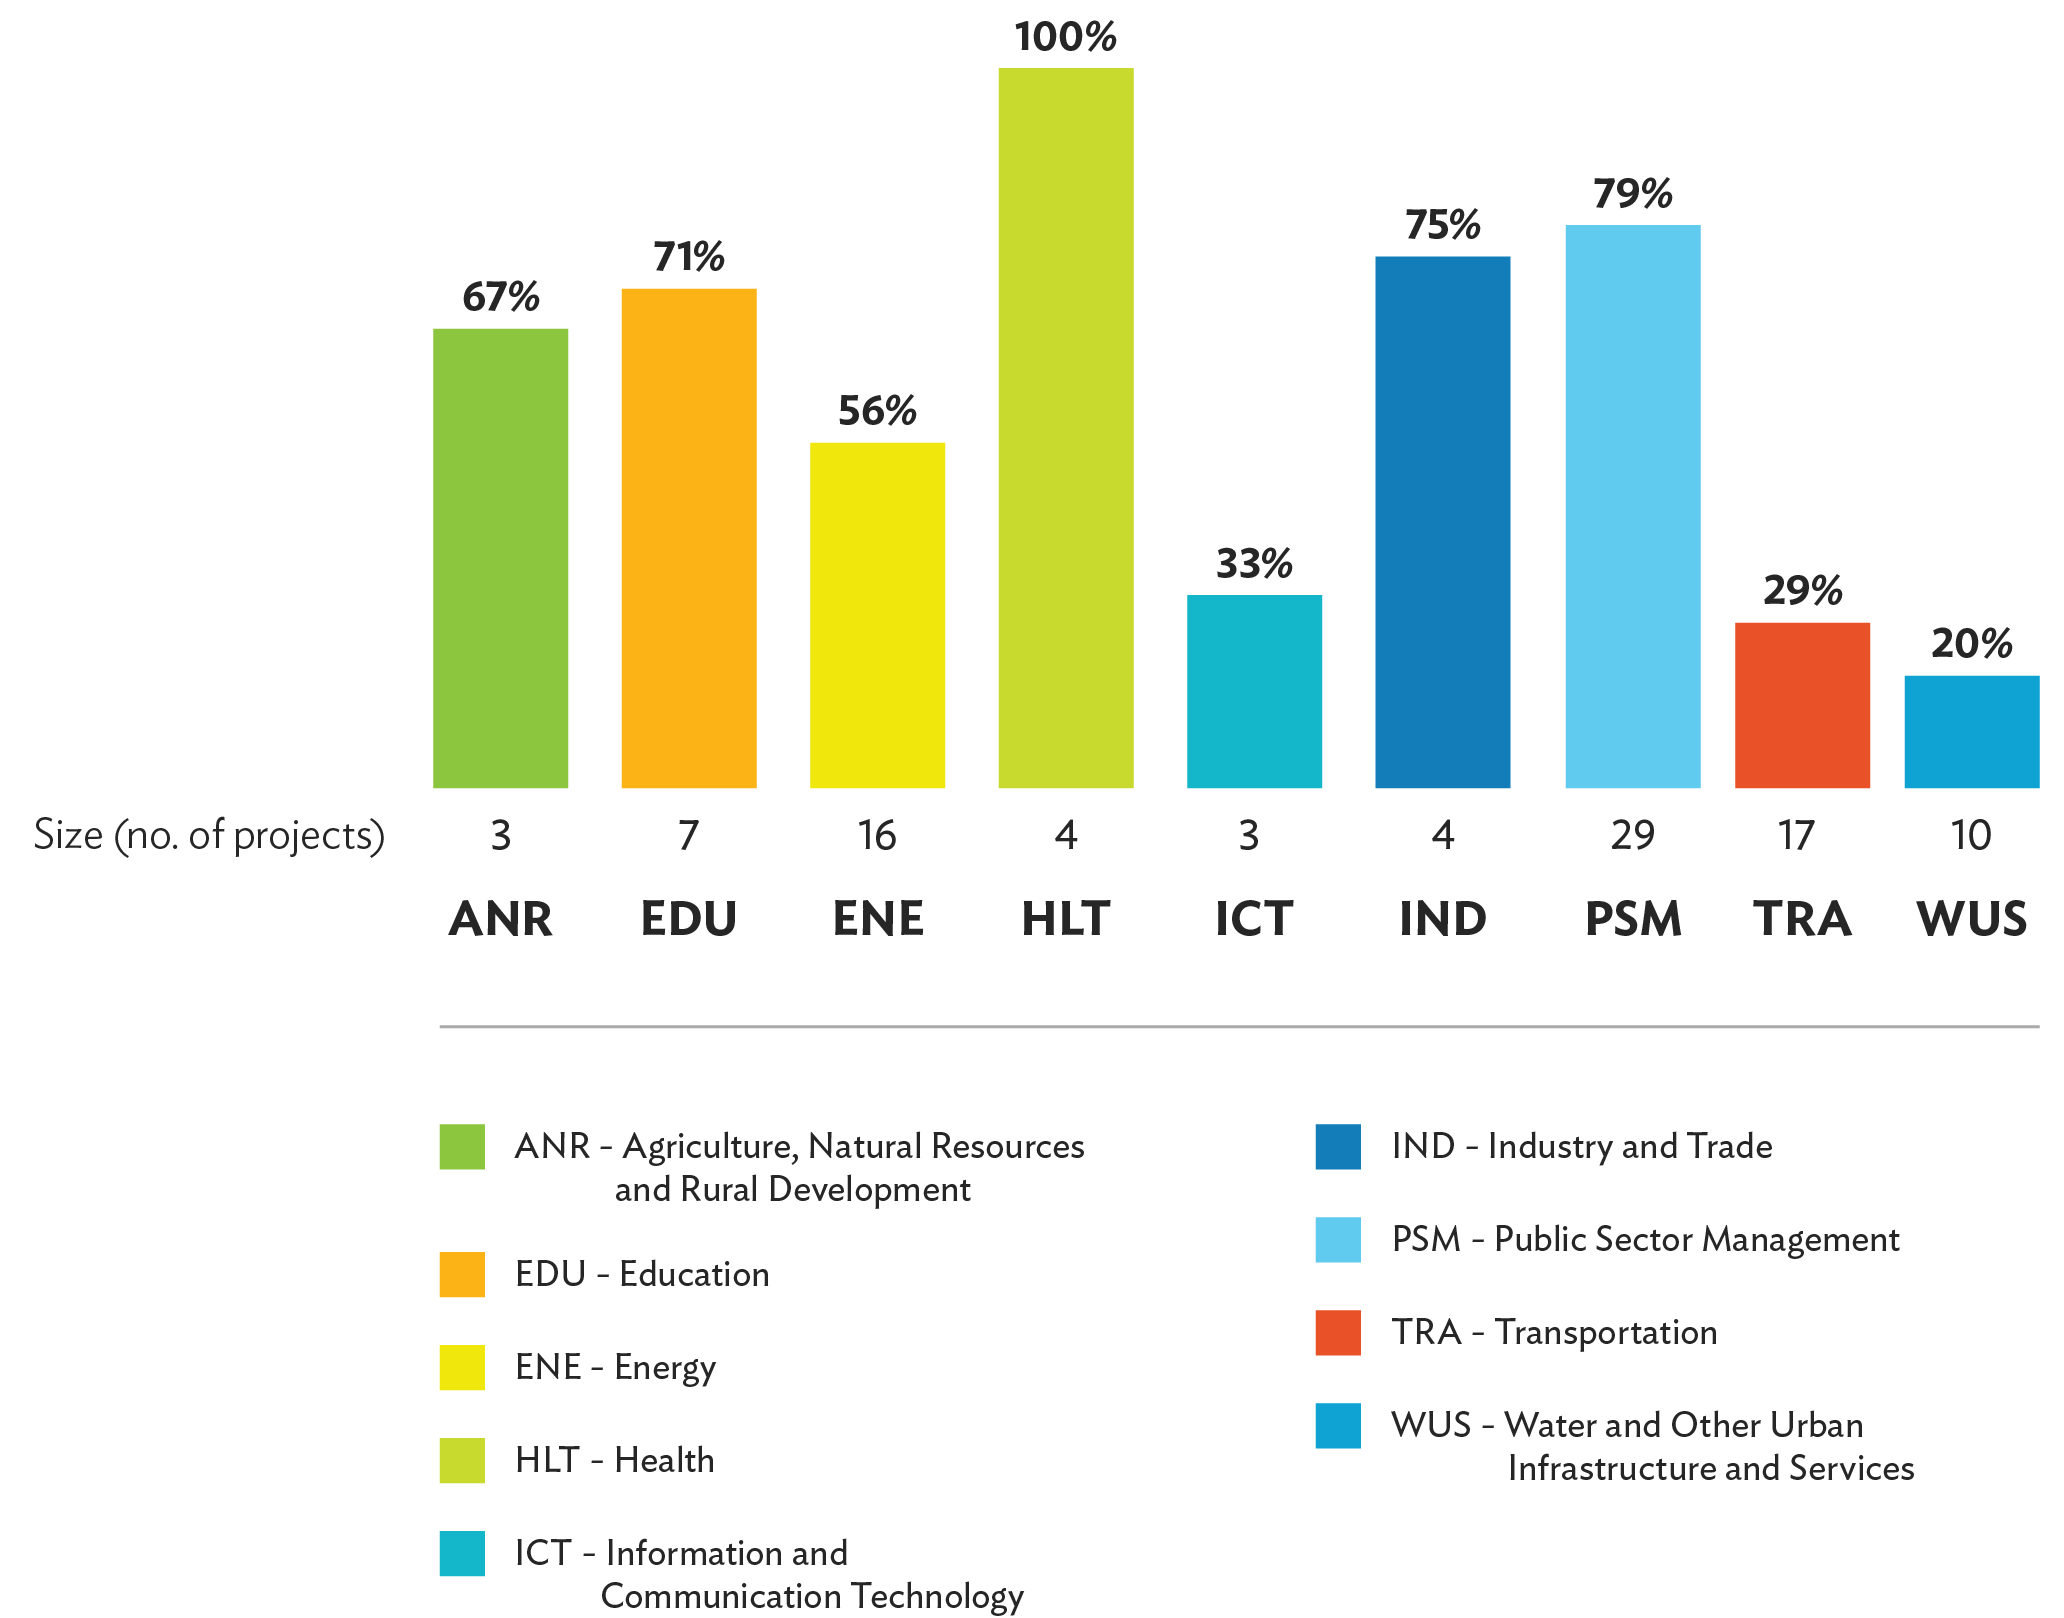
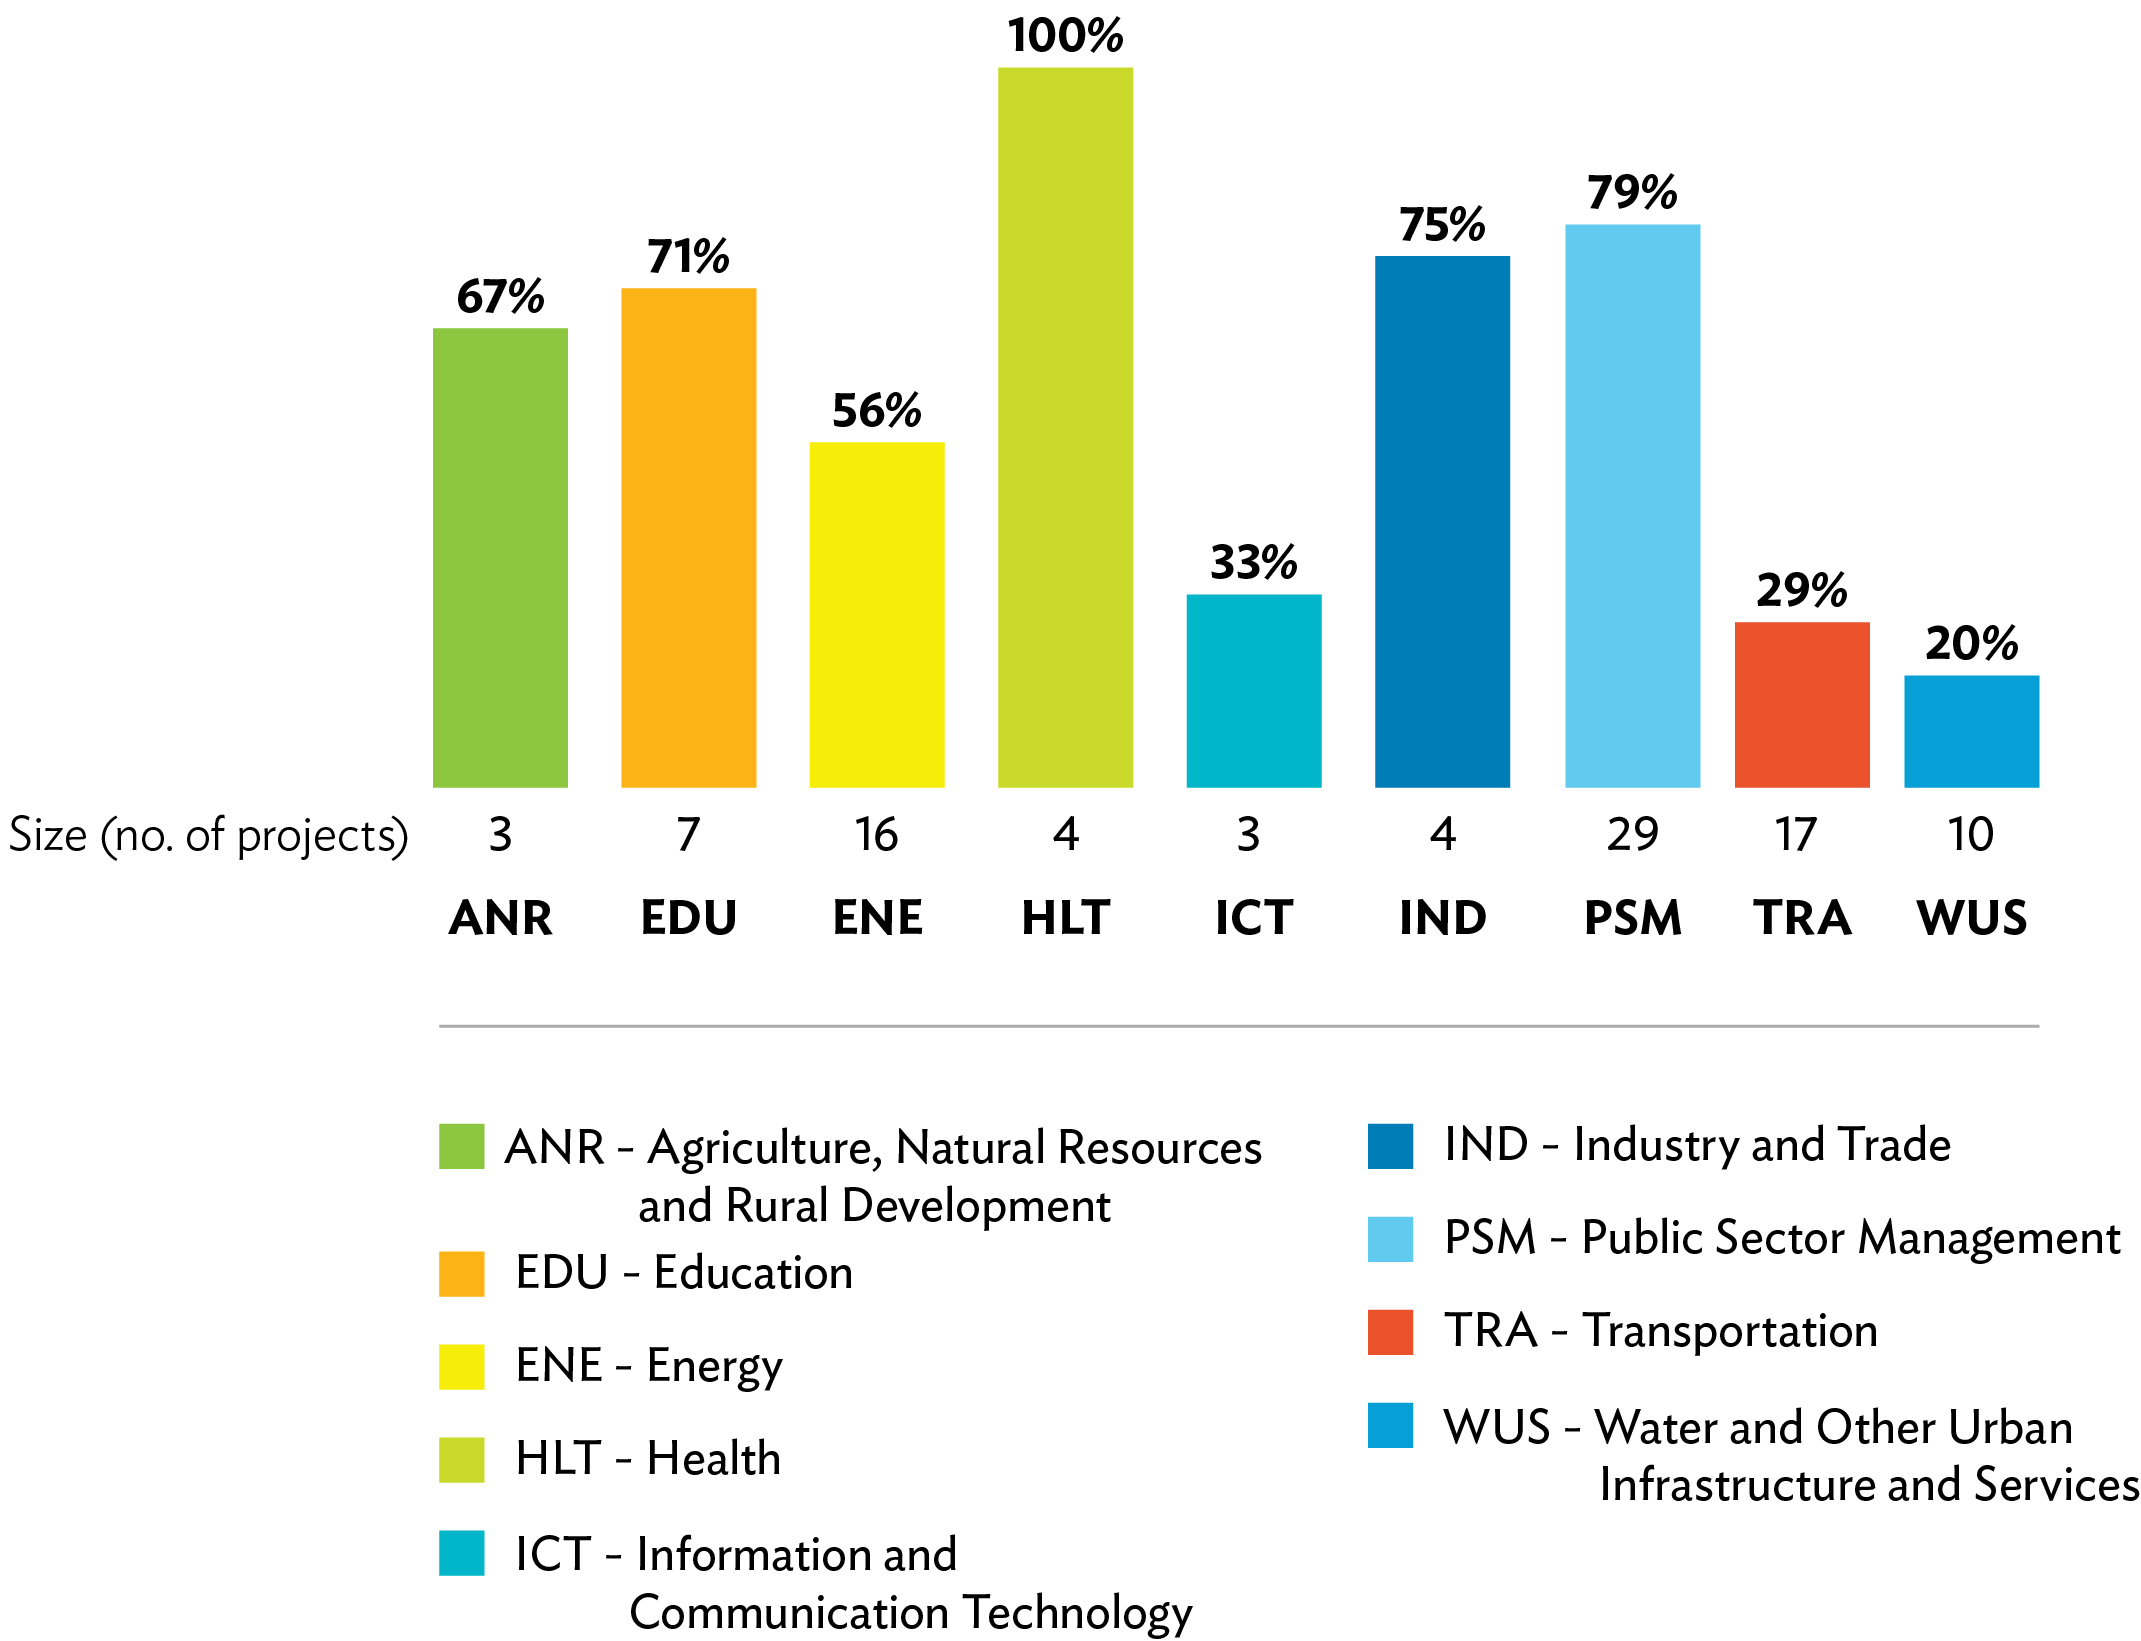
- 1.
Success rates for FCAS and SIDS have been combined because of the small number of projects.
- 2.
The finance sector is excluded as only one finance sector project was completed during the period.
- 3.
Inclusive of the baseline, 2016–2024 represents the period covered by the existing Corporate Results Framework (2019–2024).
Recurring challenges. Operations in FCAS and SIDS face recurring structural constraints such as limited institutional capacity and insufficient resources for operation and maintenance (O&M). These are exacerbated by conflict and recurring climate disasters, which draw government resources from the delivery of development projects and other basic services. Project validation reports of completed operations in 2024 cite the following factors contributing to less than successful ratings for projects in FCAS-classified DMCs and SIDS:
- (i)
ambitious project design that is not aligned with low institutional capacity or challenging site conditions, resulting in output and outcome targets being only partially achieved;
- (ii)
procurement delays caused by a lack of government staff resources or unfamiliarity with ADB guidelines, further aggravated by the coronavirus disease (COVID-19) pandemic; and
- (iii)
insufficient funding and/or local capacity for sustained O&M.
Additional issues include lack or limited collection of data to evaluate project performance, identify implementation issues, or determine the root causes of low performance; and weak land acquisition and resettlement plans.
C.Actions to Address Challenges
The FSA 2023 Annual Report detailed actions being taken by operations departments as well as actions being led by CCFE to tailor project designs, improve project and procurement readiness, develop government capacity, and improve data quality for projects in FCAS-classified DMCs and SIDS. These actions, which continued in 2024, are summarized below, along with recommendations for additional remedial actions to address the recurring challenges outlined in the previous paragraph. 16
Aligning project designs to local capacity and country conditions. Projects in FCAS-classified DMCs and SIDS are often constrained by project designs that are not aligned with government capacity. ADB must adapt project designs to match local capacity while considering smaller projects or simpler designs that are easier to scale up, and providing sufficient capacity support. Robust ownership indicators should also be established to ensure that government commitment is maintained. Project design and implementation schedules should reflect the actual capacity of executing and implementing agencies. Projects require a clearly defined partnership agreement with the government on human and financial resources, as well as on the timeline for critical actions. For infrastructure projects, adequate O&M and training contracts should be included. It is important that the work to improve project design starts early—during the development of country partnership strategies (CPSs) and project pipelines—to ensure that project designs align with government capacity and take into account specific fragility (e.g., heightened gender inequalities deepened by remoteness and capacity gaps) or conflict situations. ADB project officers should also be familiar with vulnerability, fragility, and resilience to support proper alignment of project design with local capacity and conditions.
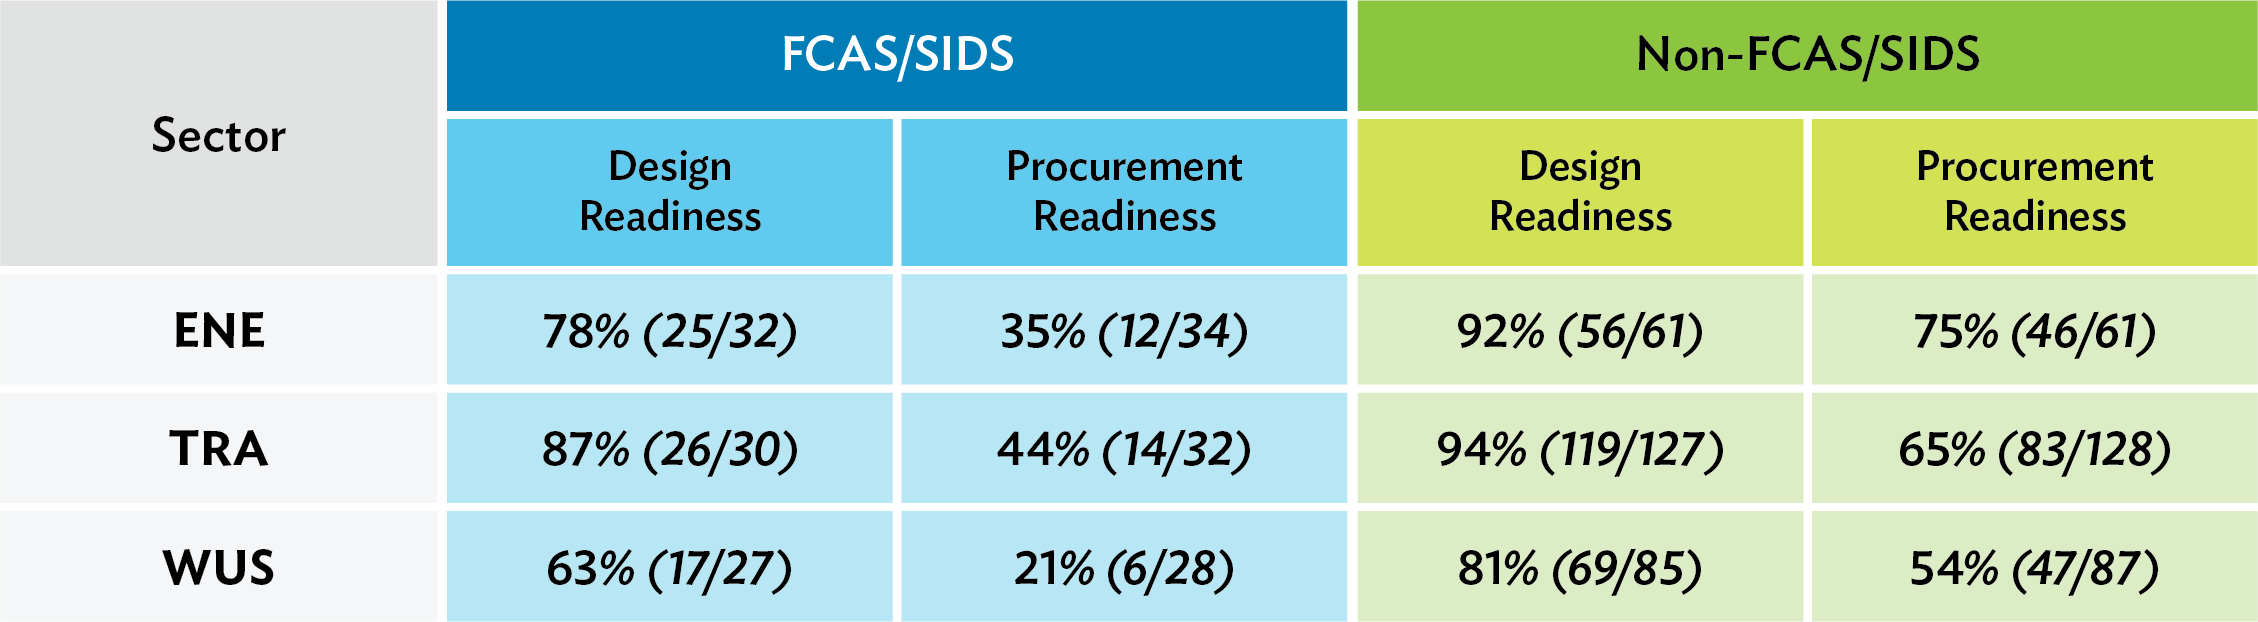
Increasing design and procurement readiness of infrastructure projects.
The FSA, the FSA midterm review, and the FSA 2023 Annual Report identified low design readiness 17 and low procurement readiness as chronic issues contributing to the low success rates of completed infrastructure projects in FCAS-classified DMCs and SIDS. Low design and procurement readiness are particularly acute in the energy, transport, and WUS sectors (Table 1). Improving persistent design and procurement readiness issues in FCAS and SIDS contexts through differentiated procurement approaches is a major thrust of the FSA and of ADB internal training. In addition, ADB continues to promote the use of project readiness financing to support the scale-up of sovereign and nonsovereign operations under ADB’s new capital adequacy framework. 18
Procurement Readiness of
Infrastructure Projects, 2016–2024
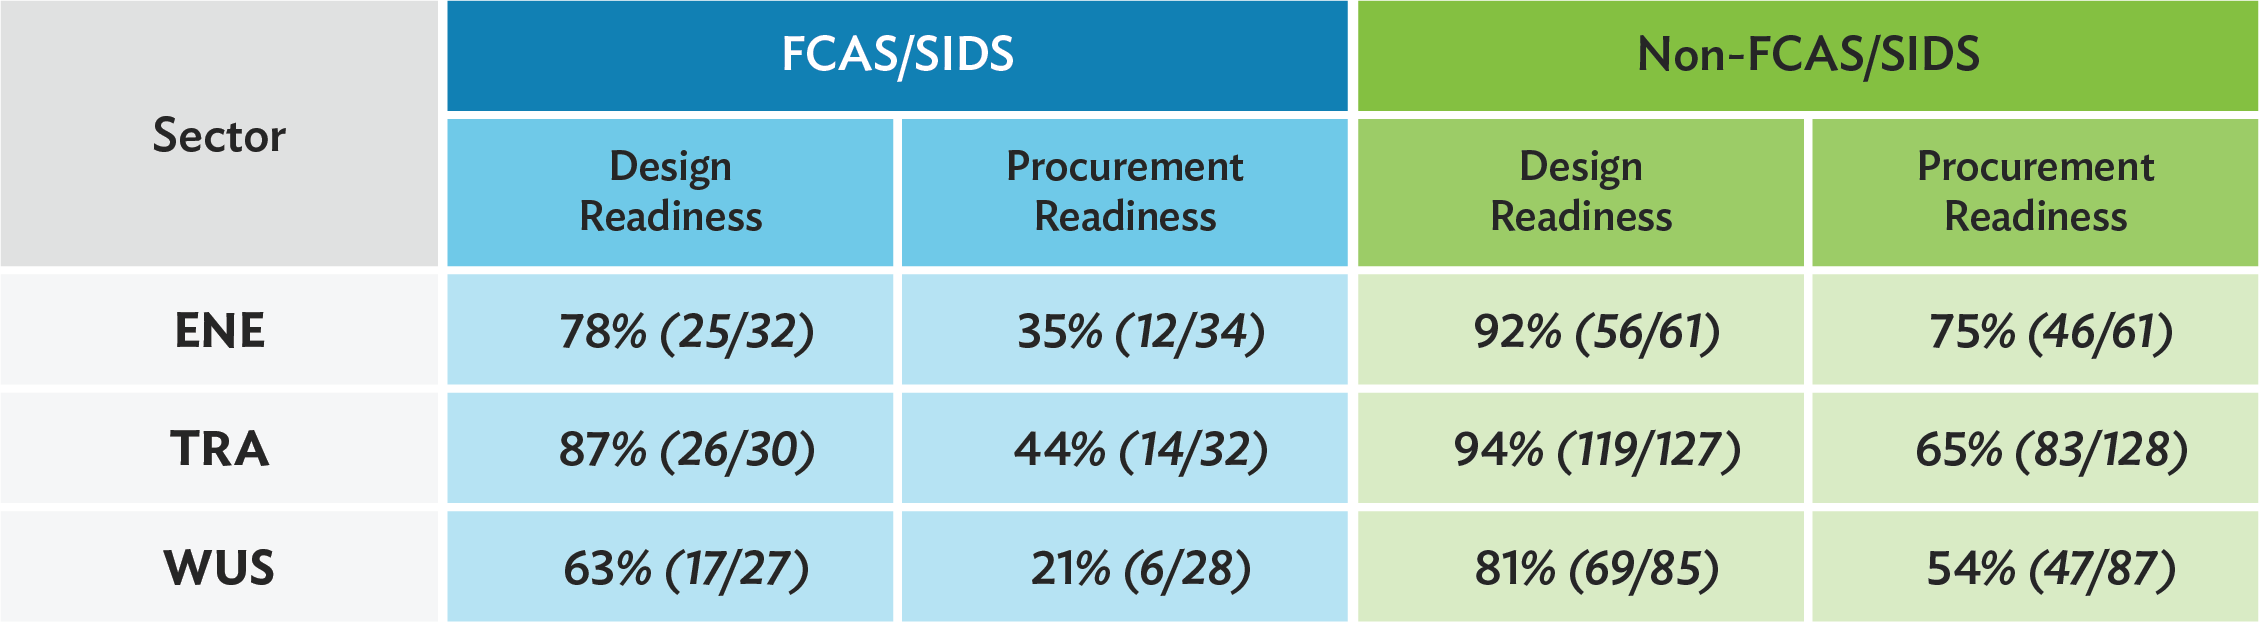
SIDS = small island developing states, TRA = transport, WUS = water and other urban infrastructure and services.
- 1.
The small variances in the denominators for design and procurement readiness are due to additional financing for cost overruns and project preparatory financing.
- 2.
Additional financing due to cost overruns do not have new design requirements, and thus are not tagged for design readiness, while project preparatory activities likewise do not have design readiness tagging.
Robust capacity development. Weak government capacity in FCAS and SIDS is another recurring issue highlighted in the FSA 2023 Annual Report and in project validation reports of FCAS and SIDS from 2016 to 2024. Projects in FCAS and SIDS require rigorous assessment of government capacity, supported where feasible by CCFE capacity assessment and support plans, to address the limited capacity of local agencies. The capacity of government agencies must be thoroughly assessed with respect to investment planning, financial management, engineering, and project implementation functions, as well as post-investment O&M activities. Detailed assessments of the financial position of executing agencies and implementing agencies are needed, including remedial measures to address shortcomings, as the financial health of the operating entity is paramount to the sustainability of a project.
Improved data. Lack or limited collection of data and/or poor data quality make it difficult for project teams to evaluate project performance, identify implementation issues, or determine the root causes of low performance. Collection and thorough analysis of quality baseline data, including climate and economic data, lead to robust forecasts at appraisal. Detailed modeling, data gathering, and site assessment during project design in infrastructure projects will obviate the need to revise the project during implementation. More robust data analytics and diagnostic work will build ADB staff’s understanding of vulnerability, fragility, and resilience dimensions and specific risks confronting DMCs, contributing to improved project design.
More rigorous monitoring and evaluation. Project teams should be more proactive in monitoring project implementation in FCAS and SIDS. A project monitoring system should be established before the start of implementation to ensure activities are effectively monitored, delays addressed, and pertinent data collected for analysis or as evidence of progress. Regular audits and site visits are necessary to ensure that contractors perform consistently and comply with safeguard requirements. It is contingent on the resident mission to assist the executing agency in identifying corrective measures and even use its technical resources to assist in resolving issues. To improve monitoring and evaluation of infrastructure projects, project officers should consider engaging engineering and project management consultants and/or contractors with experience working in FCAS and/or SIDS to work near the project site.
Improved land acquisition and resettlement plans. Land acquisition issues need to be made clear to executing and implementing agencies at the early stages of a project. Project officers should consider completing land acquisition prior to ADB Board consideration or selecting only project sites that do not have land disputes or noncustomary sites. In addition, it is essential to have robust safeguards that not only preserve natural resources, livelihoods, and cultural resources, but also support engagement of communities in project implementation. Land acquisition and resettlement plans should include a comprehensive risk assessment to summarize potential impacts on affected persons and articulate mitigation measures. The implementation schedule should allow sufficient time for land acquisition and resettlement plans to be developed.
D.Success Rates Grouped
by Approval Year
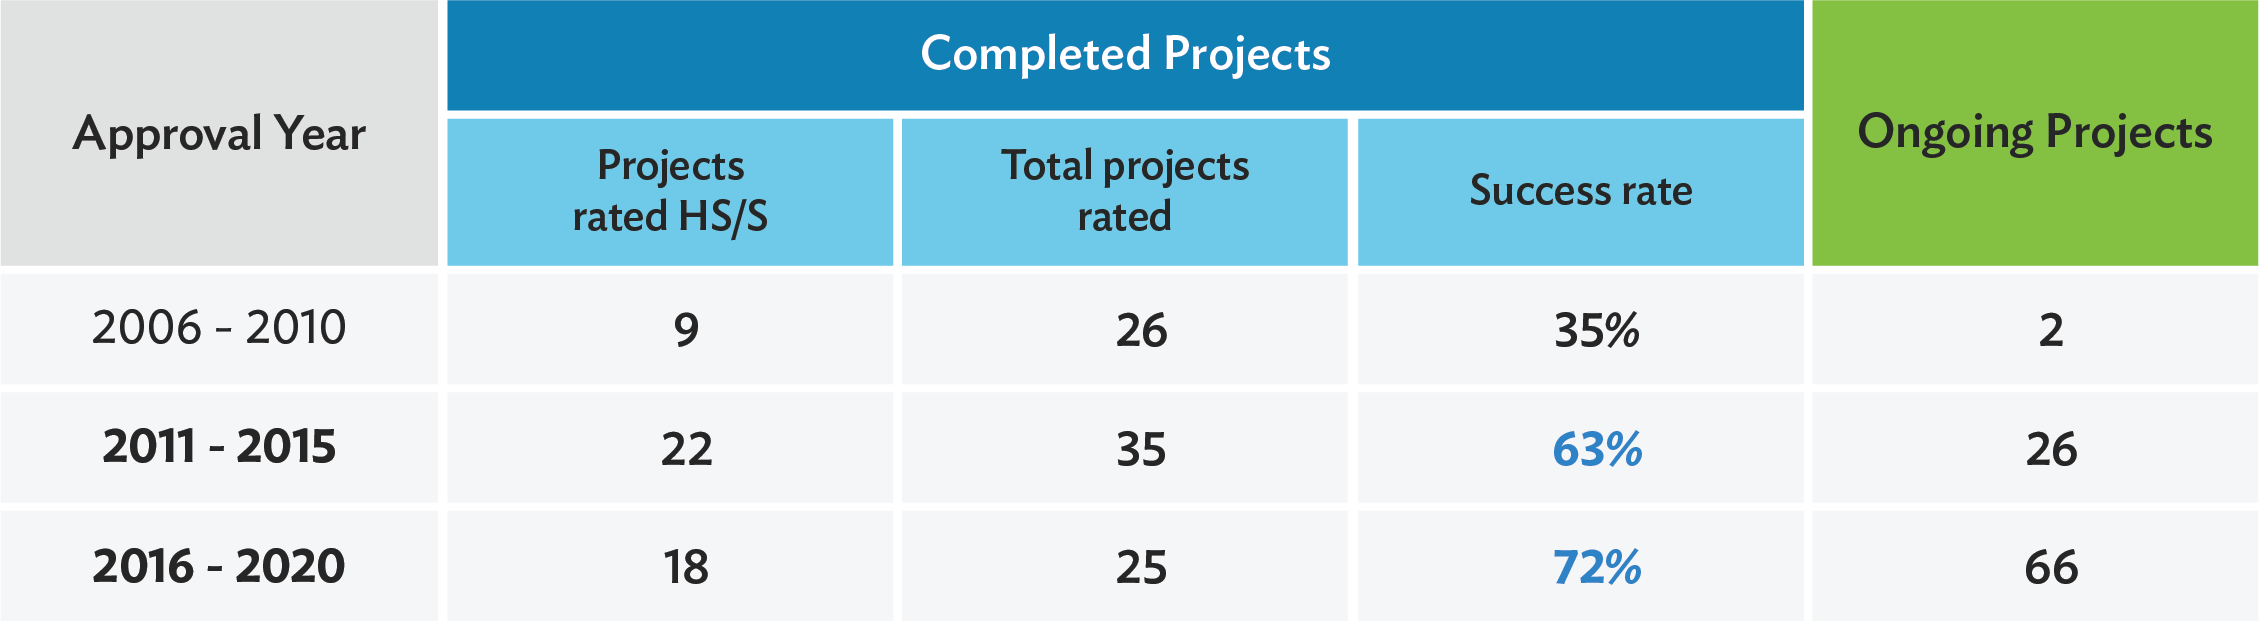
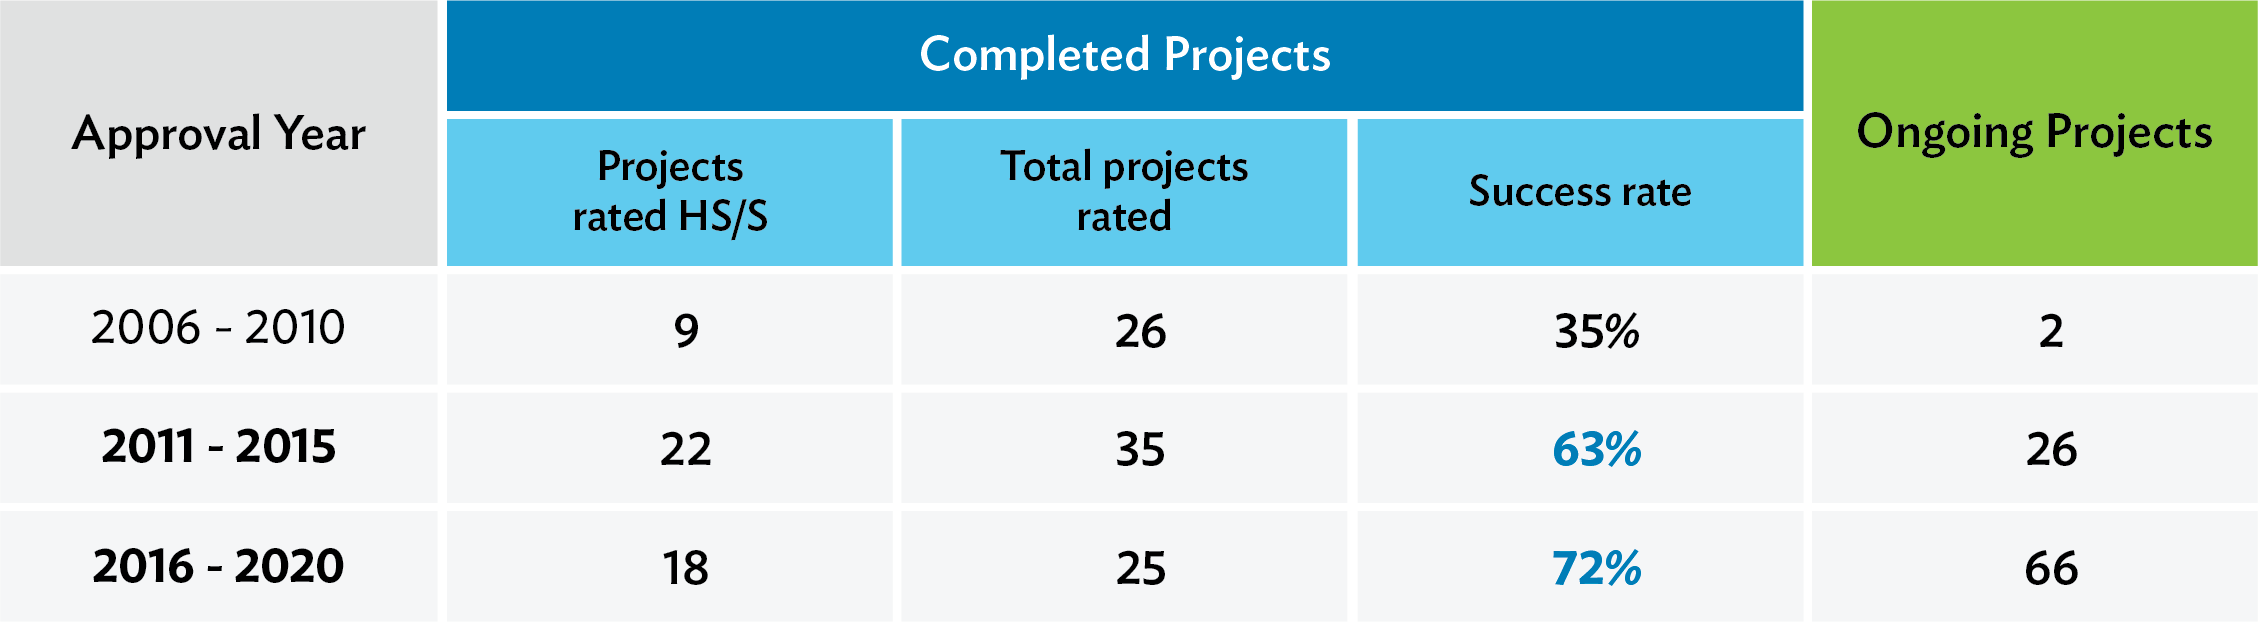
Success rates of completed operations are measured as a 3-year rolling average based on completion year. By this measure, success rates of completed operations in FCAS and SIDS have shown little or no improvement since approval of the FSA in 2021. However, if grouped on the basis of approval year, there has been notable improvement of success rates in FCAS and SIDS. From a 35% success rate for projects approved during 2006–2010, the success rate improved to 63% for projects approved during 2011–2015 and 72% for those approved during 2016–2020. Considering ongoing projects, the periods 2011–2015 and 2016–2020 only require about one-third of their ongoing projects to be rated successful to surpass the 35% success rate of projects approved during 2006–2010.
Table 2: Success Rates of Completed Operations in FCAS and SIDS, Grouped by Approval Year
- 1.
The table includes projects that were completed during 2016–2024, which is the period covered by the current corporate results framework, including the baseline period of 2016–2018.
- 2.
The approval periods 2001–2005 and 2021–2024 were excluded from the table because few projects have been rated for these periods (six projects rated for 2001–2005 and two projects rated for 2021–2024).
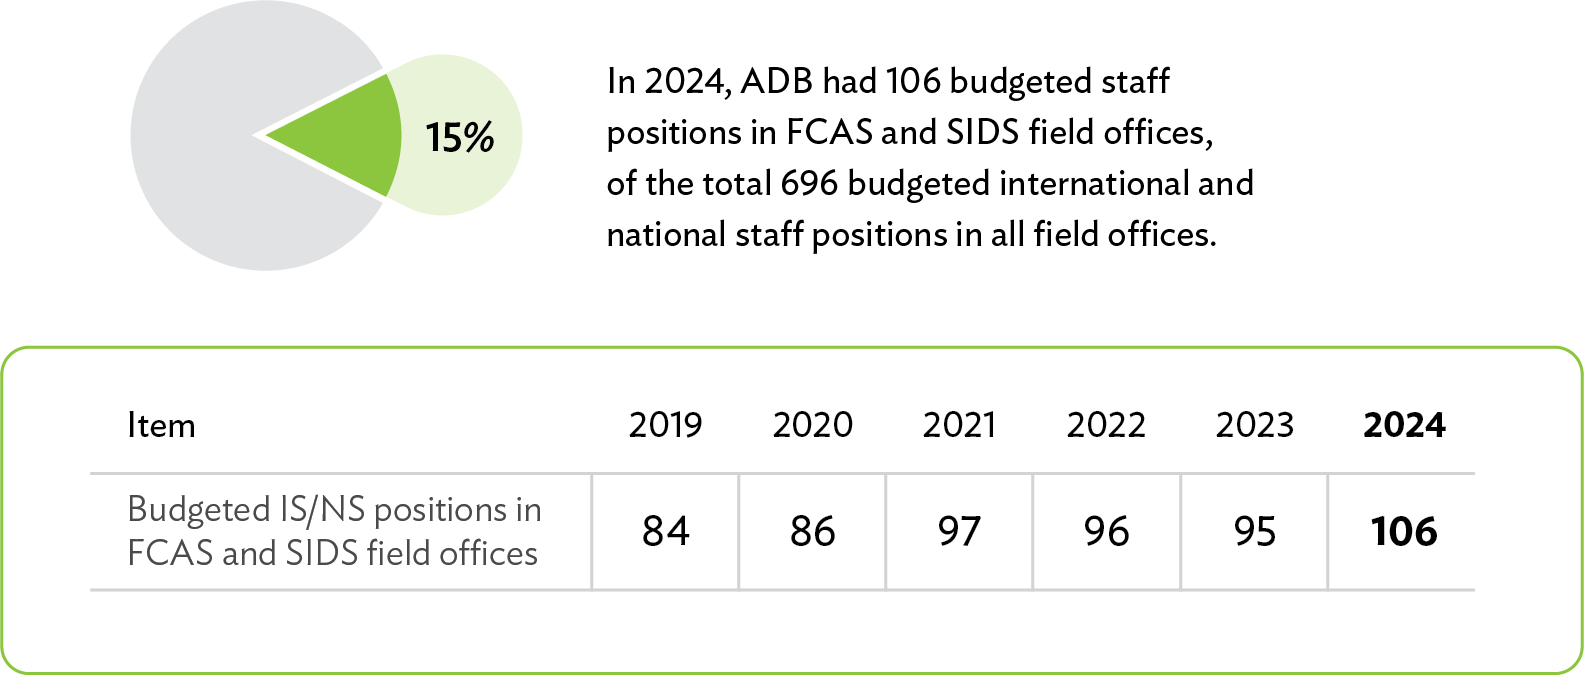
3.Budgeted International and National Staff in Field Offices
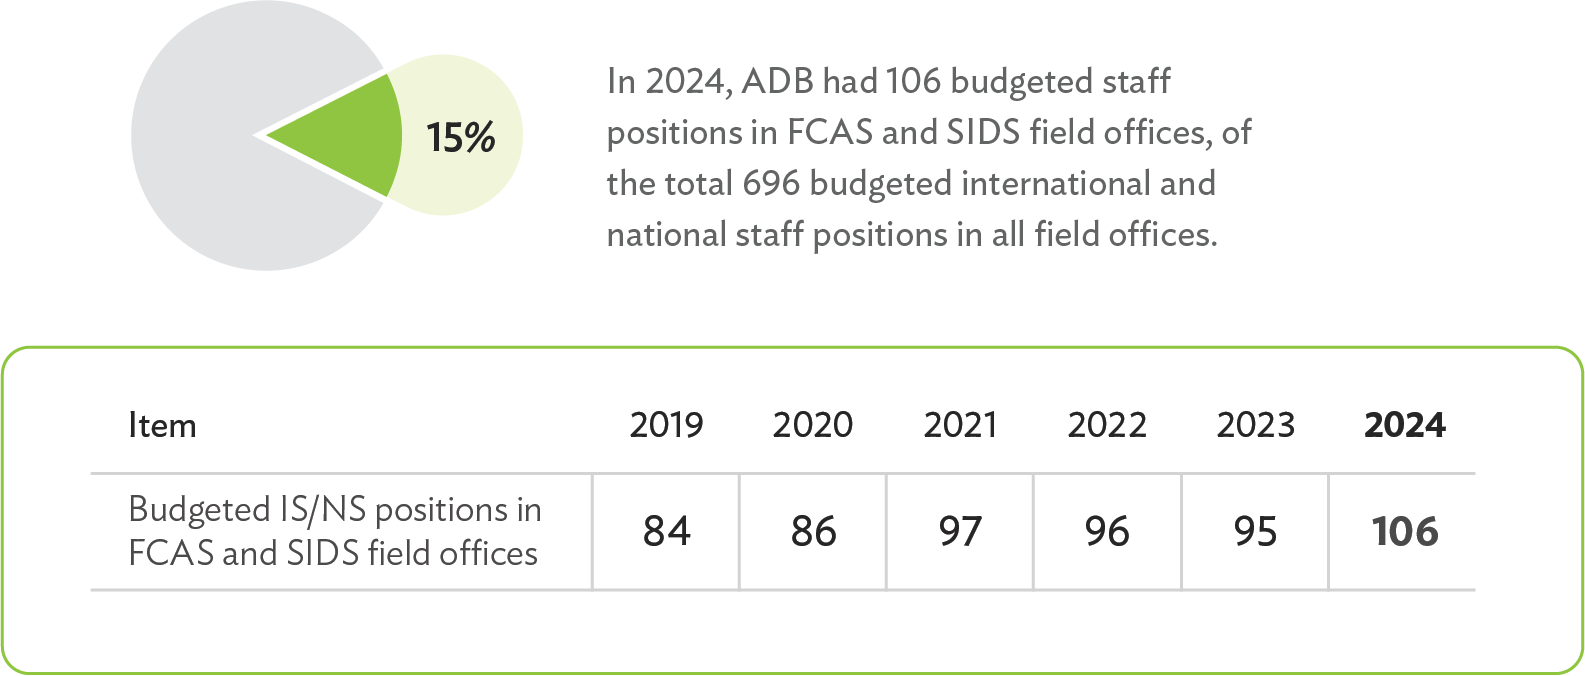
Budgeted international and national staff positions in FCAS and SIDS field offices increased significantly to 106 staff positions in 2024 from 95 in 2023, and are up from 84 in 2019—a 5-year increase of 26% (Figure 7 ).19 The increase is mainly attributed to the successful recruitment of additional financial management and procurement officers; out-posting of energy, health, and transport specialists to resident missions; and placement of additional environmental and social safeguard officers. The placements included additional staff in Timor-Leste and Solomon Islands while the out-postings were to resident missions in Fiji and PNG. The NOM and ADB's Workforce Rebalancing Framework 20 will further increase field expertise in key operational areas as ADB moves closer to its clients with the aim of increasing collaboration with DMCs. A stronger field office presence brings more regular opportunities for ADB to closely monitor operations, support capacity development of executing agencies and implementing agencies, build relationships with nongovernment organizations, and strengthen in-country partnerships and coordination mechanisms with development partners.
Figure 7: Budgeted International and National Staff Positions
in Field Offices
4.Operations with Meaningful
Civil Society Engagement
In 2024, five out of six (83%) completed operations in FCAS and SIDS that planned to include meaningful civil society organization (CSO) engagement during project implementation delivered accordingly. 21 One such project is the Pakse Urban Environmental Improvement Project in the Lao People’s Democratic Republic (Lao PDR) (Box 1).
Thrives Through
Community Engagement
The NGO and Civil Society Center (NGOC) under CCFE works on enhancing civil society engagement across ADB, including in FCAS and SIDS. Some highlights of NGOC activities in fragile contexts in 2024 include support for operations and engagement of civil society representatives in knowledge events. In operations, NGOC supported preparation of ADB’s CPS for Fiji, 2024–2028. 22 In January 2024, ADB organized a discussion with CSOs as part of its outreach to engage key stakeholders in the country. The meeting identified opportunities for CSOs to be involved in ADB-supported projects and activities. Also in 2024, ADB’s Papua New Guinea Resident Mission, with the support of NGOC, initiated the creation of a Civil Society Advisory Forum to strengthen cooperation with diverse civil society stakeholders in the country. The advisory forum serves as a consultative body to discuss issues related to ADB strategy and operations in the country, particularly where inputs from civil society are relevant.
In supporting knowledge events, in October, NGOC hosted a Girls Takeover in celebration of the 2024 International Day of the Girl at its headquarters, in partnership with Plan International Asia-Pacific and Plan International Pilipinas. The event focused on the theme “Girls' Leadership in Climate Action” and featured a girl from PNG speaking on the Eda Davara Marine Sanctuary. Furthermore, as part of its CSO Conversations webinar series, NGOC hosted a webinar in November with the Public Sector Management and Governance Sector Office on “Citizens’ Budgets: Working with Governments and CSOs to Promote Budget Transparency.” The webinar explored a United Nations Development Programme–European Union project, Vaka Pasifika, on promoting open and inclusive public financial management in the Pacific. CSOs that presented at the webinar included the Pacific Islands Association of Nongovernment Organizations, based in Fiji; the Fiji Council of Social Services; and Development Services Exchange, the umbrella CSO network in Solomon Islands
C.FCAS and SIDS Portfolio
1.FCAS Sovereign Portfolio
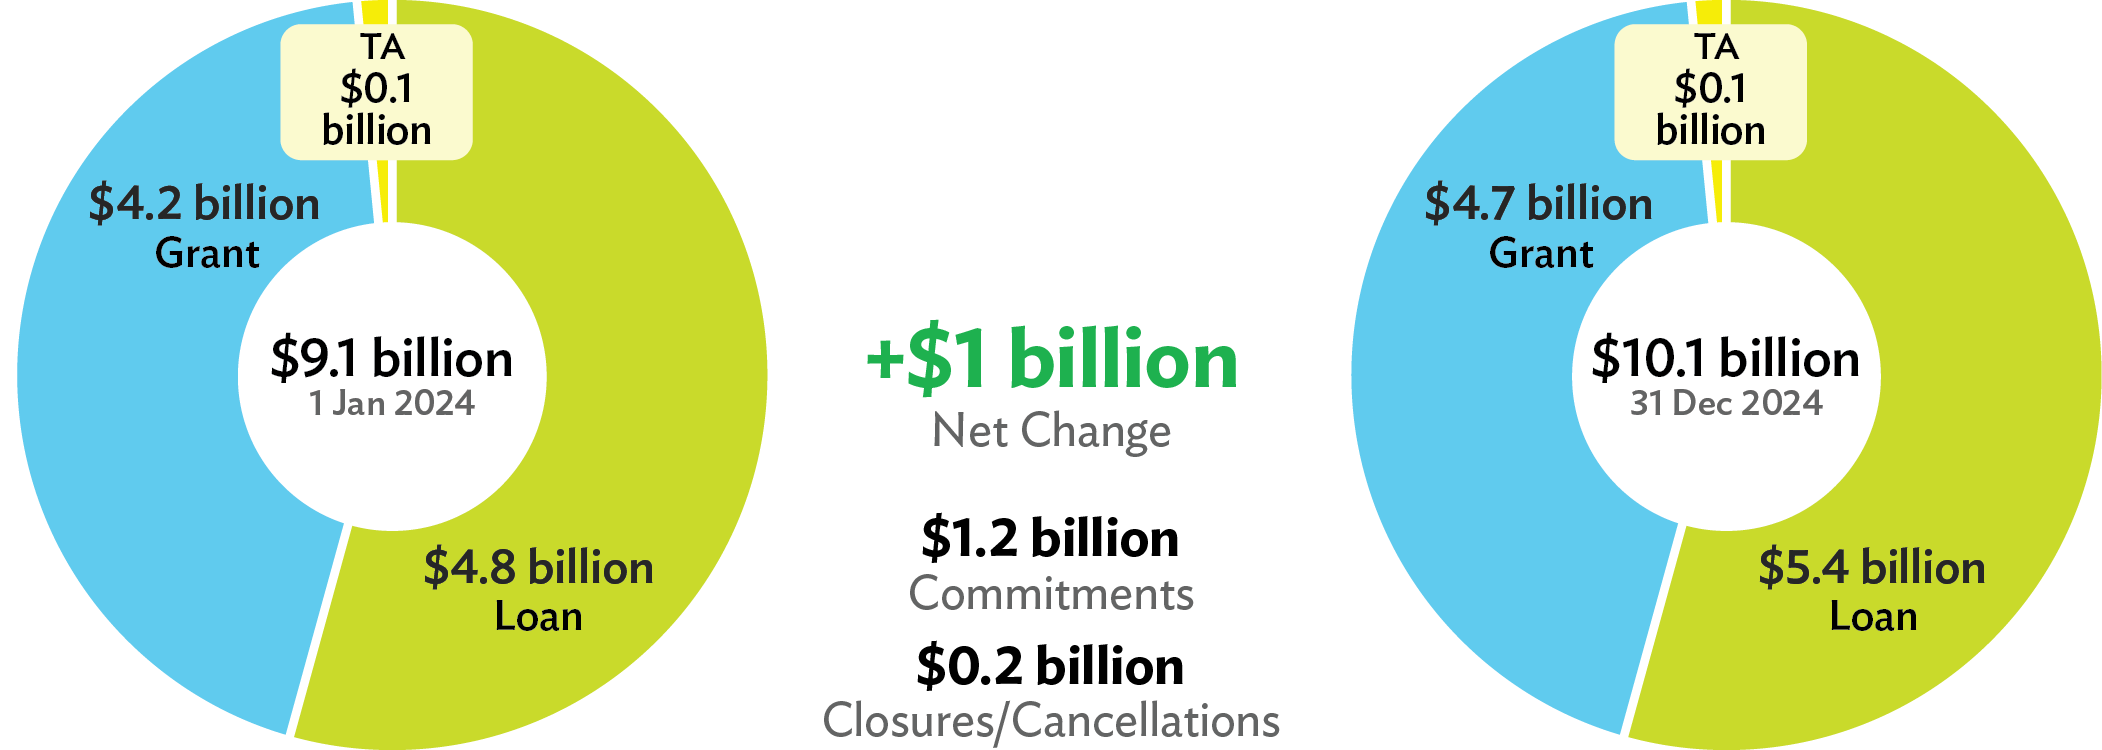
Increase in FCAS portfolio by 11%. The sovereign FCAS portfolio increased from $9.1 billion at the beginning of 2024 to $10.1 billion by year-end (Figure 8). 23 The $1.0 billion (11%) increase is the net change resulting from $1.2 billion in commitments against closures/cancellations of $0.2 billion.
Figure 8: FCAS and SIDS Sovereign Portfolio at a Glance
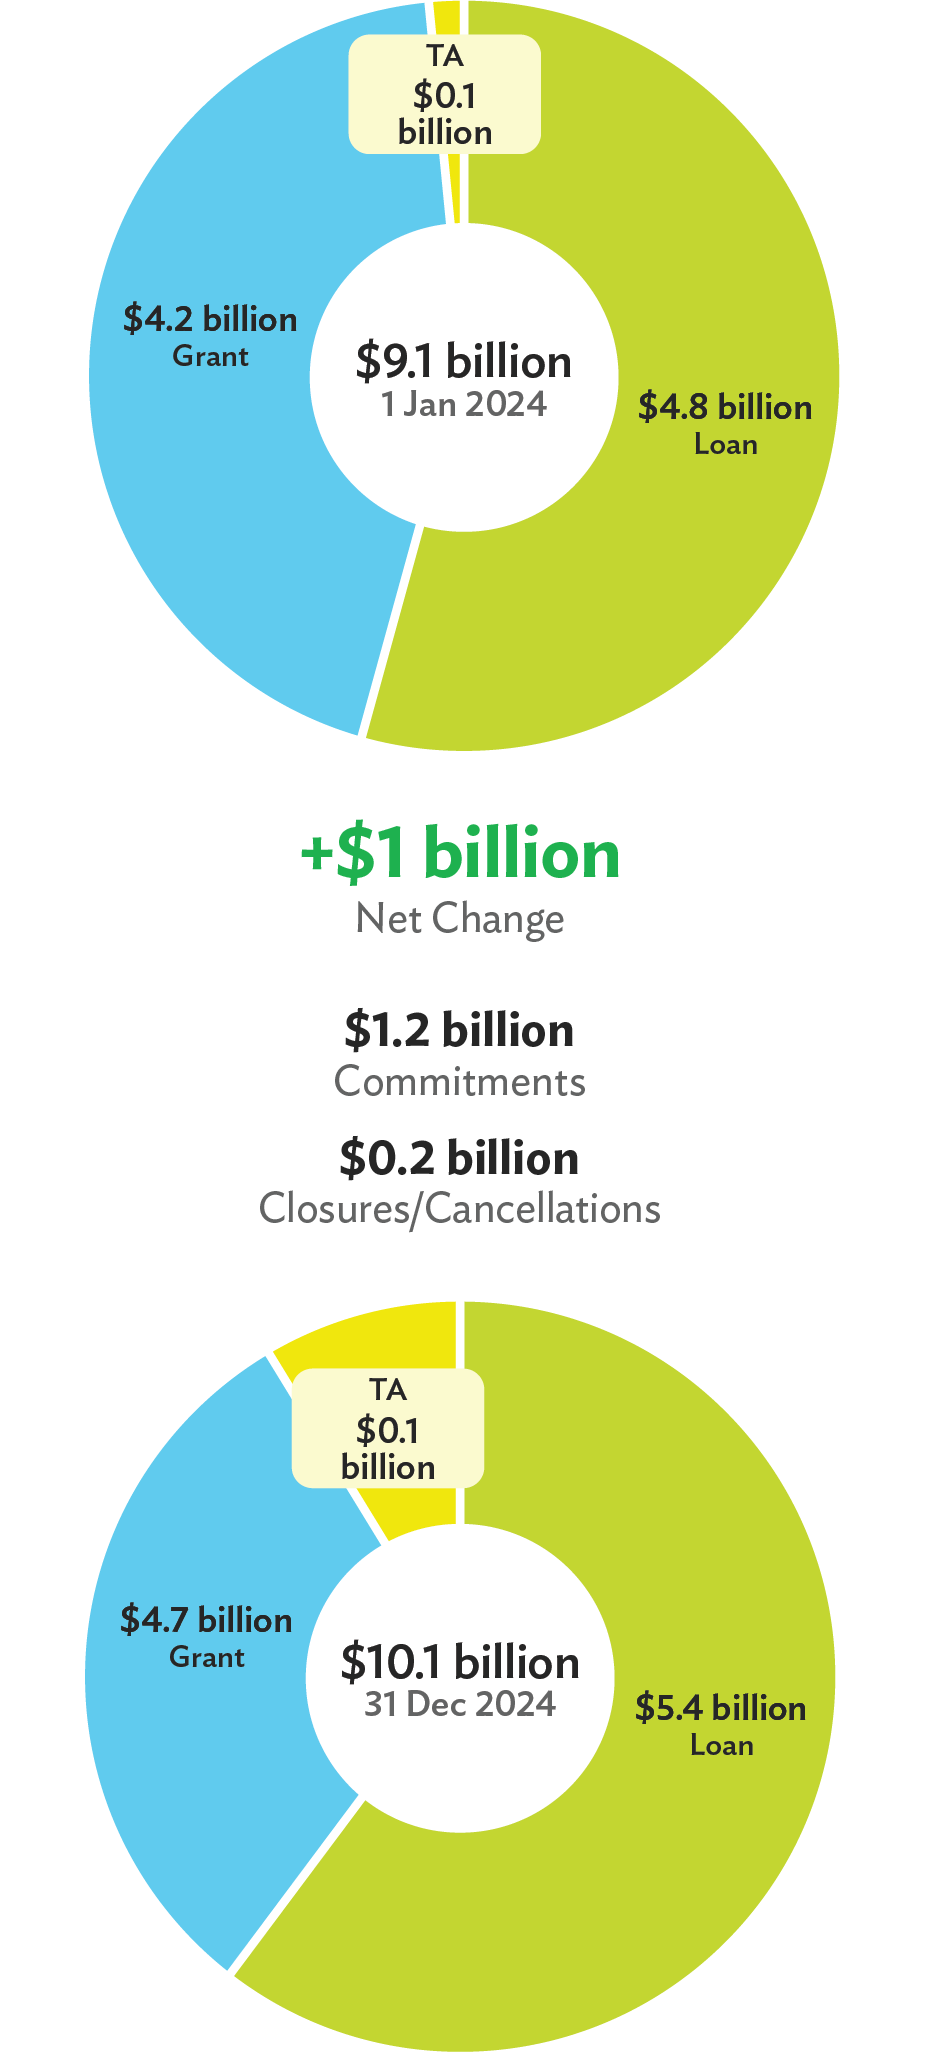
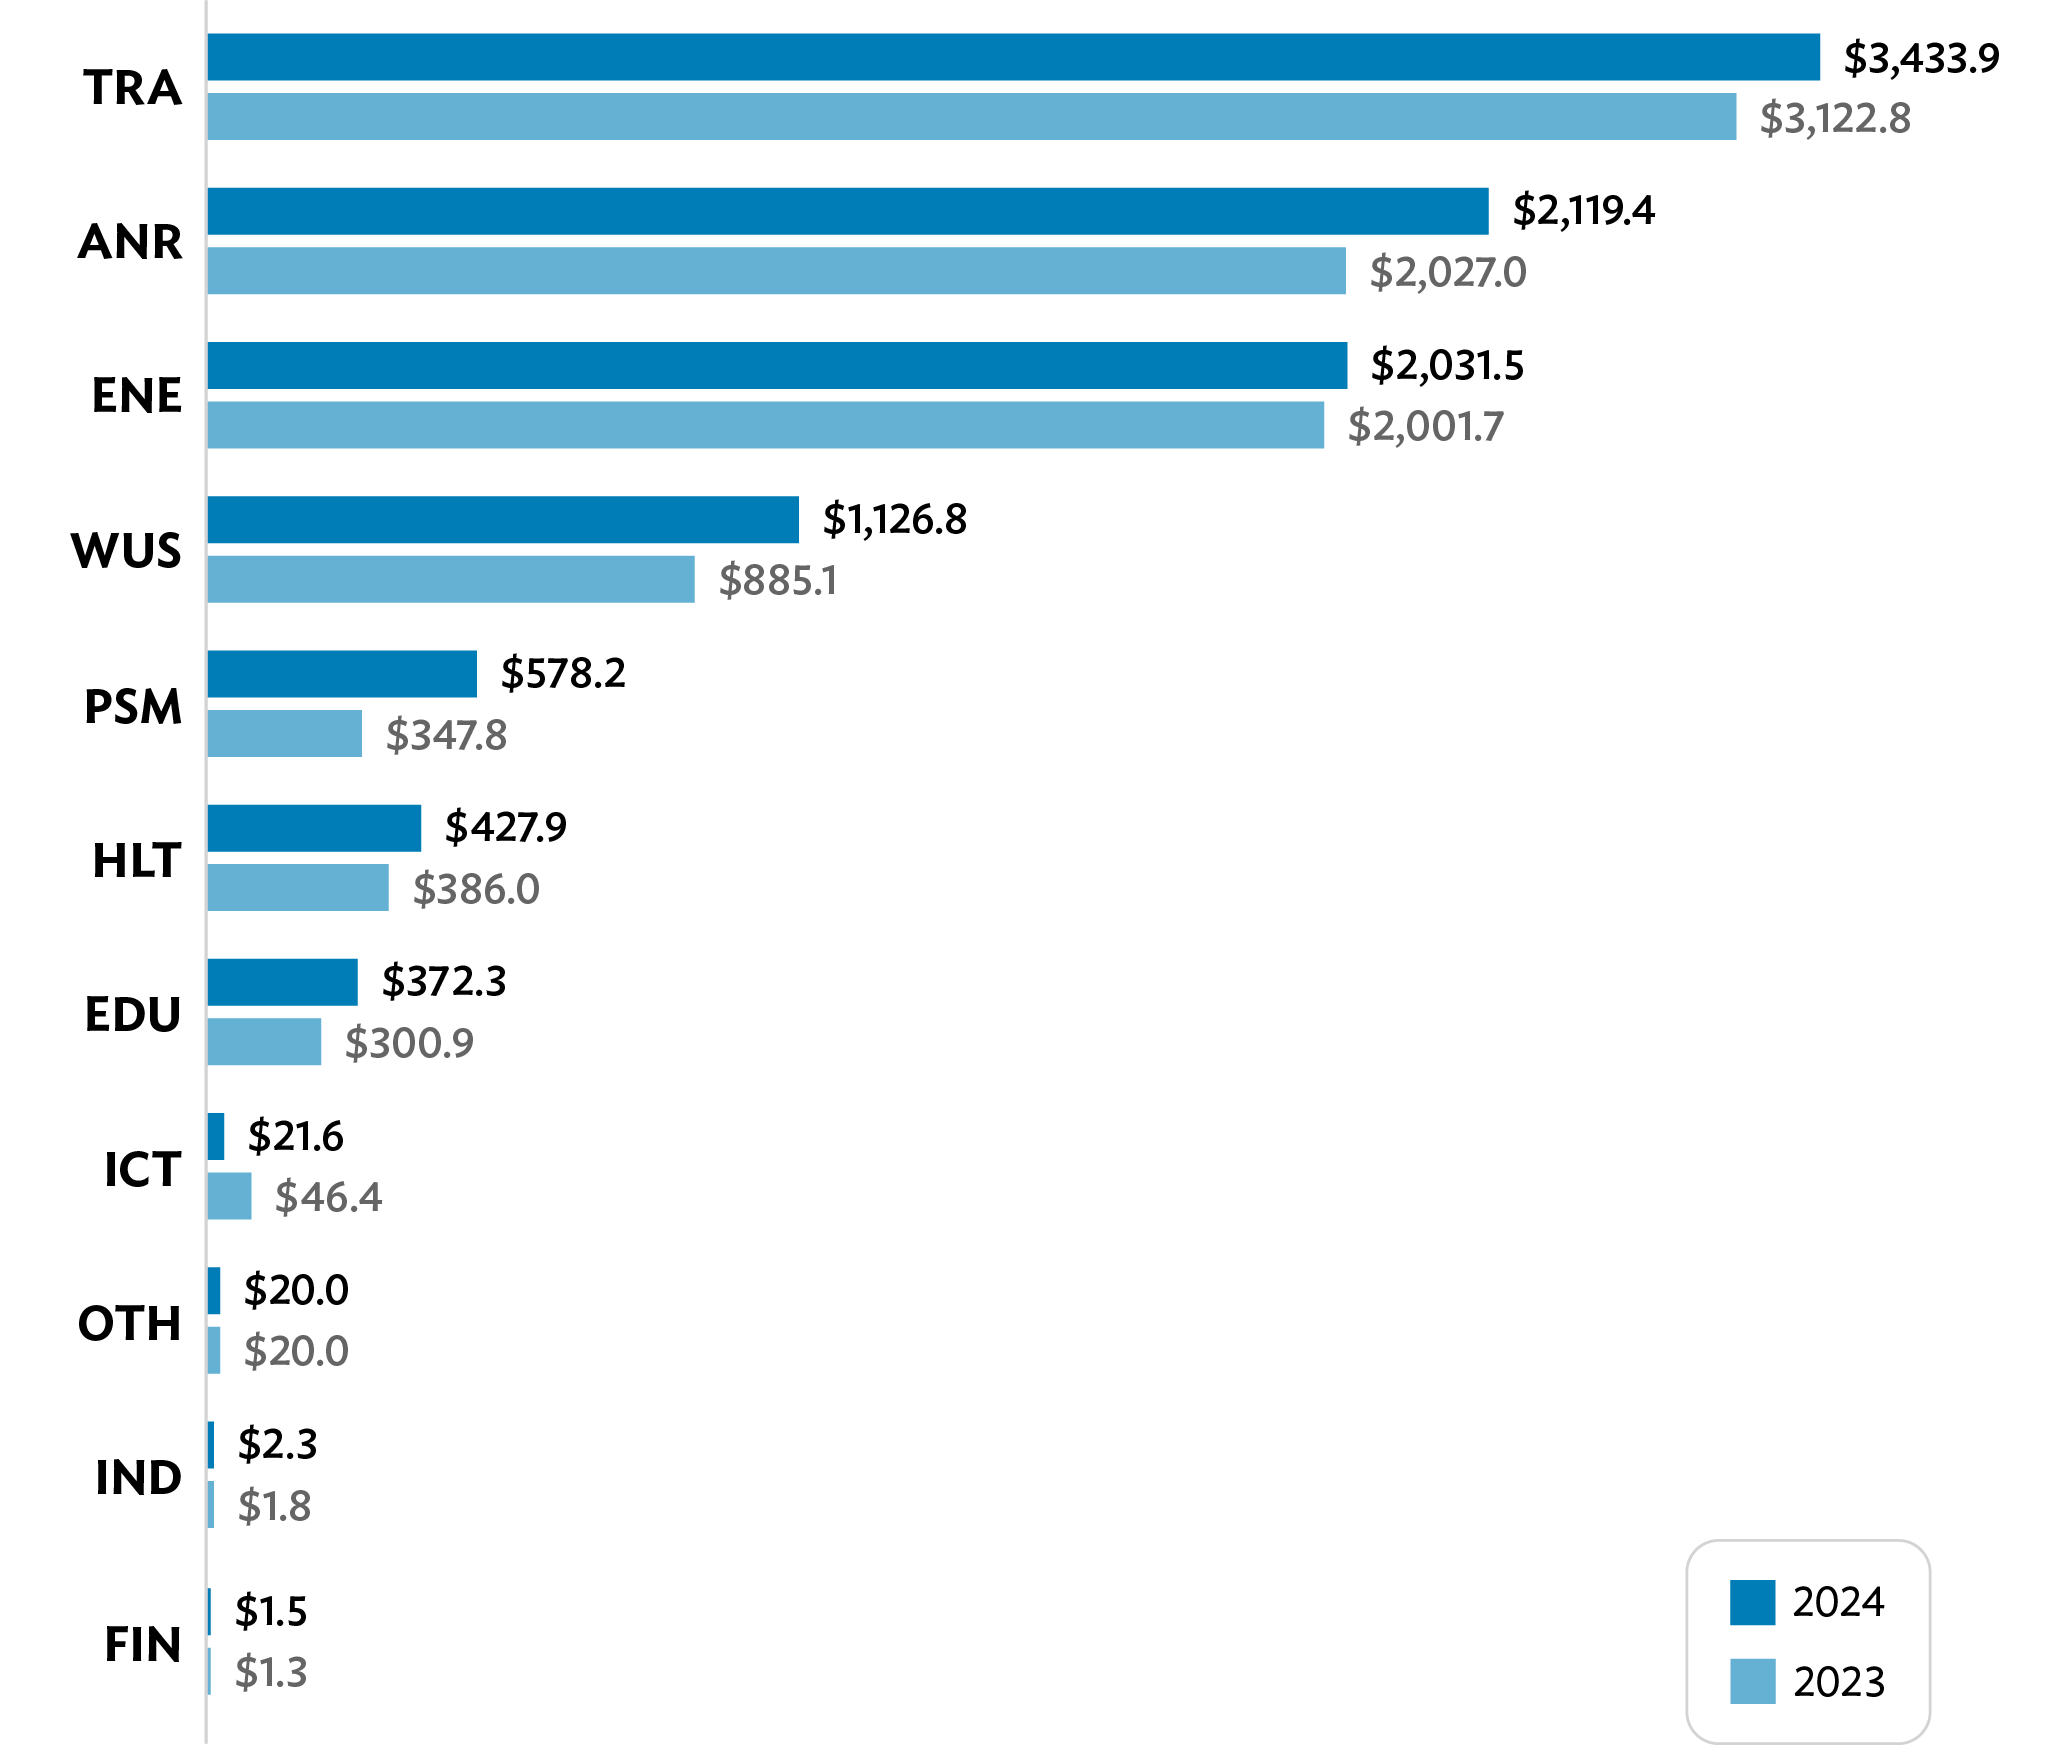
Sector breakdown. The transport ($3.4 billion), ANR ($2.1 billion), energy ($2.0 billion), and WUS ($1.1 billion) sectors comprise about 86% of the 2024 FCAS portfolio (Figure 9). The remainder is distributed across public sector management ($0.6 billion), health ($0.4 billion), and education ($0.4 billion). The increase in the portfolio from $9.1 billion at the start of the year to $10.1 billion by year-end was driven mainly by transport (net increase of $311.1 million), WUS (net increase of $241.8 million), and public sector management (net increase of $230.4 million). 24
Figure 9: FCAS Portfolio by Sector
(active committed projects and technical assistance as of 31 December 2024,
in $ million)

Country breakdown. Afghanistan ($3.2 billion), Myanmar ($2.5 billion), PNG ($1.8 billion), the Lao PDR ($0.8 billion), and Timor-Leste ($0.6 billion) accounted for about 88% of the FCAS portfolio as of the end of 2024 (Figure 10). Among FCAS-classified DMCs, the largest portfolio increases in 2024 were in PNG (net increase of $359.2 million), the Lao PDR ($195.0 million), Solomon Islands ($144.0 million), and the Marshall Islands ($101.7 million). 25 Although ADB placed its regular assistance on hold in Myanmar effective 1 February 2021 and in Afghanistan effective 15 August 2021, 26 it remains committed to providing humanitarian and sustainable livelihood support for the people of Myanmar and supporting the economic and social development of the people of Afghanistan.
Figure 10: FCAS Portfolio by Country
(active committed projects and technical assistance as of 31 December 2024,
in $ million)
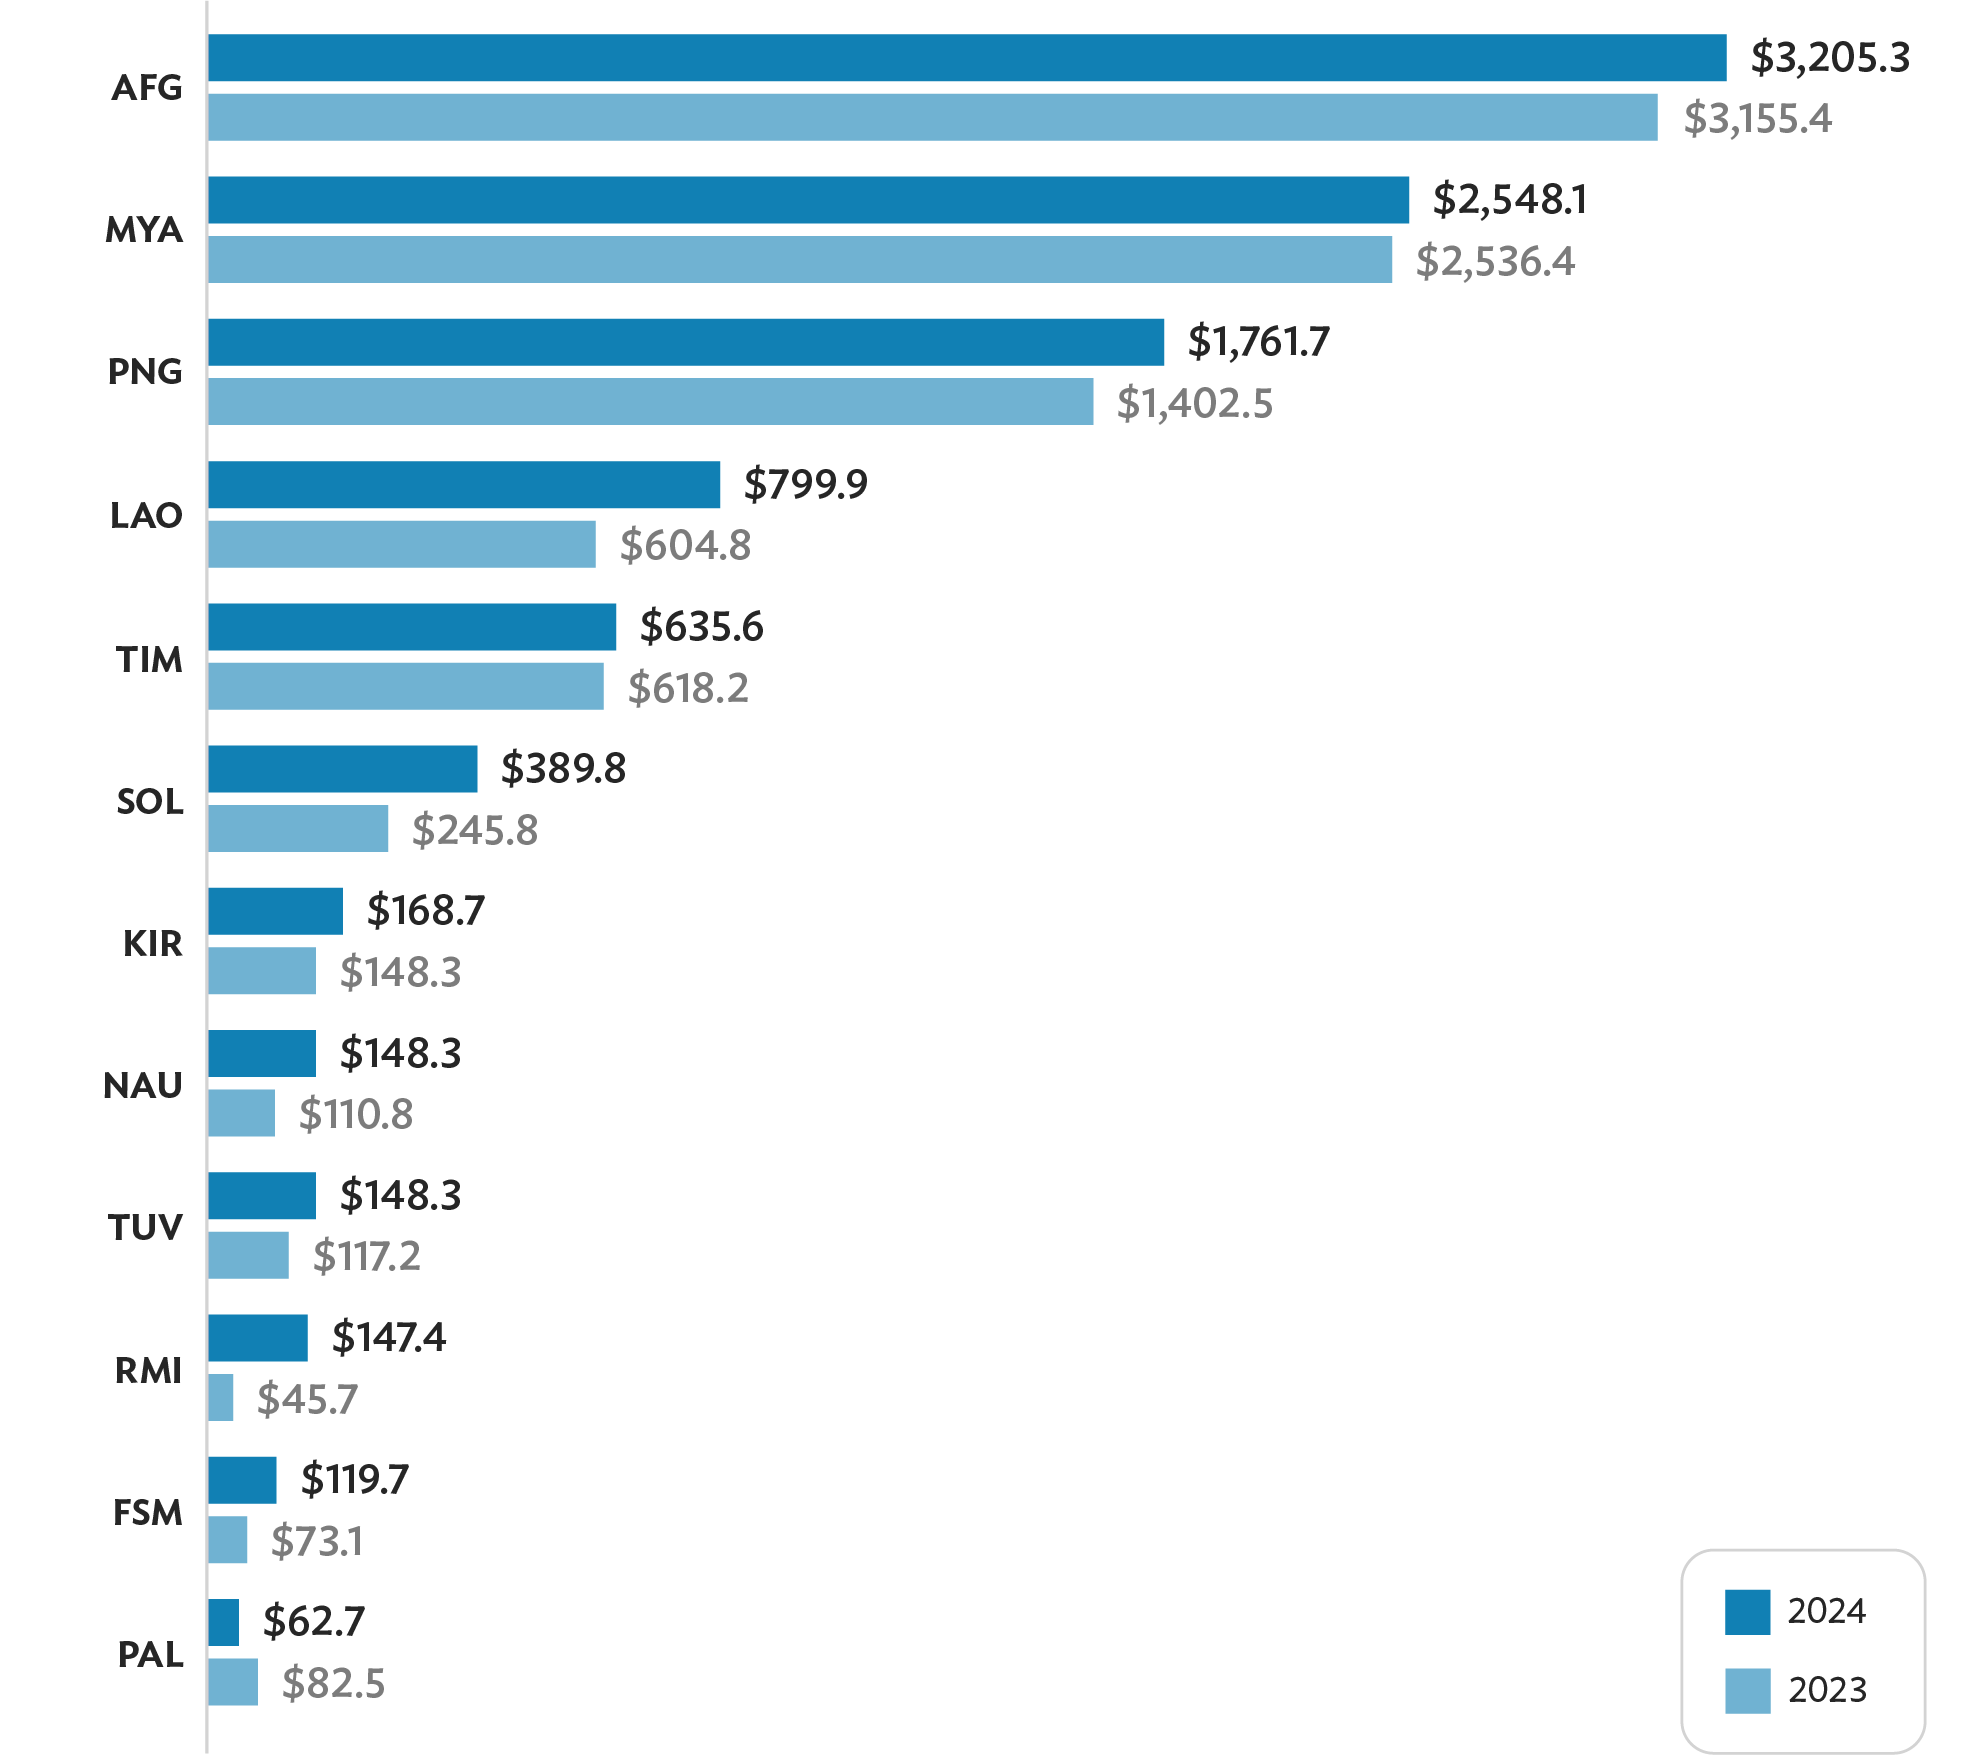
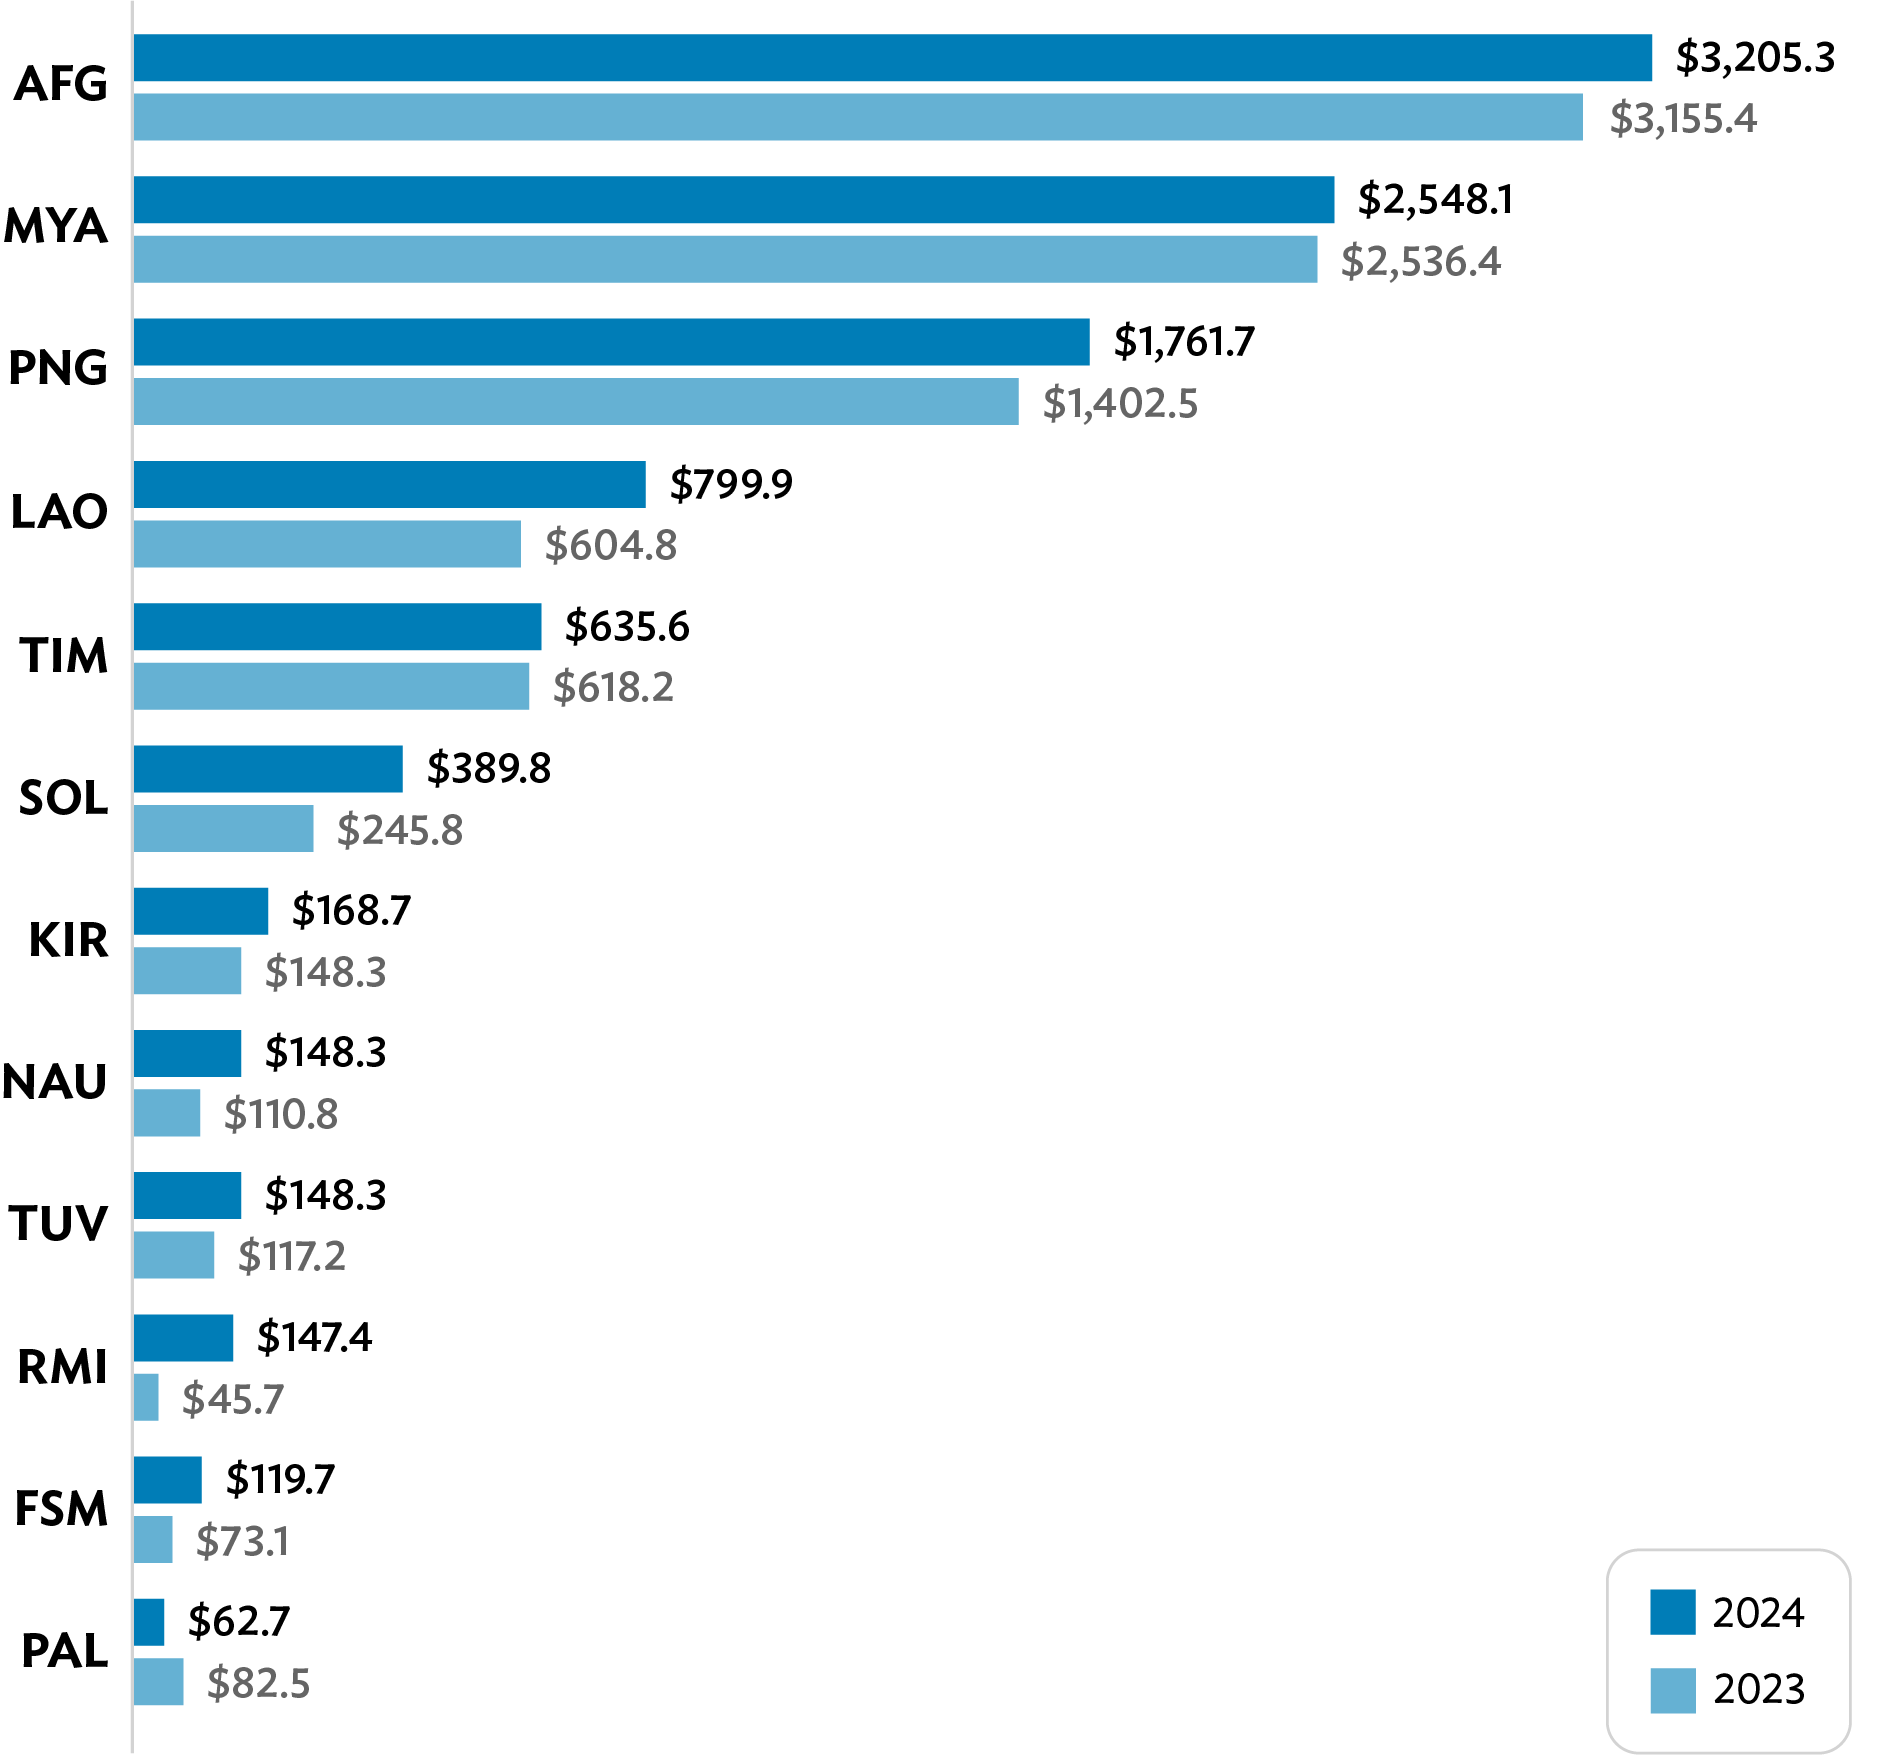
LAO = Lao People’s Democratic Republic, MYA = Myanmar, NAU = Nauru,
PAL = Palau, PNG = Papua New Guinea, RMI = Republic of the Marshall Islands,
SOL = Solomon Islands, TIM = Timor-Leste, TUV = Tuvalu. Source: Asian Development Bank.
Improved FCAS project portfolio performance. As of the end of 2024, 60% of ongoing projects in FCAS-classified DMCs (45 out of 75 projects) were rated
on track, which was an improvement from 47% in the previous year (Figure 11). The improved performance is attributed to FCAS-classified DMCs’ recovery from the COVID-19 pandemic after 2023. As operations returned to normal, projects increased disbursements and improved progress toward target outputs. Projects rated for attention declined from 42% to 32%, while projects rated
at risk declined from 11% to 8%.
For projects rated for attention, 39% of the reported issues pertained to financial management. Financial management issues were attributed to delayed submission of audited project financial statements because of significant capacity constraints of projects and supreme audit institutions (SAIs). In the North Pacific, projects were significantly impacted by the departure of Deloitte from the region and the slow uptake by E&Y, which is still catching up on the backlog. Solomon Islands is gradually returning to full use of country systems and reliance on SAI, which caused some delays.
ADB is utilizing multiple technical assistance (TA) to bolster capacity both
within SAIs and within projects. It has also increased the size of the financial management team in the Pacific for greater understanding of country challenges and how best to deliver support while being able to provide more granular country support. Furthermore, project design and monitoring carefully consider the financial management capacity of executing agency and implementing agency staff, ensuring identified gaps are addressed as early as possible including a focus on financial management readiness during processing.
Meanwhile, low contract award (35% of reported issues) and low disbursement (29%) were the two most-cited issues for projects rated at risk. A majority of at risk projects (four out of six) were in Timor-Leste. Projects approved by the previous administration in Timor-Leste were under review by the new government for more than 1 year, which delayed implementation. A couple of projects had resumed operations by year-end, and special administration missions are planned to update contract award and disbursement milestones.
Figure 11: Project Performance Ratings in FCAS-Classified Countries
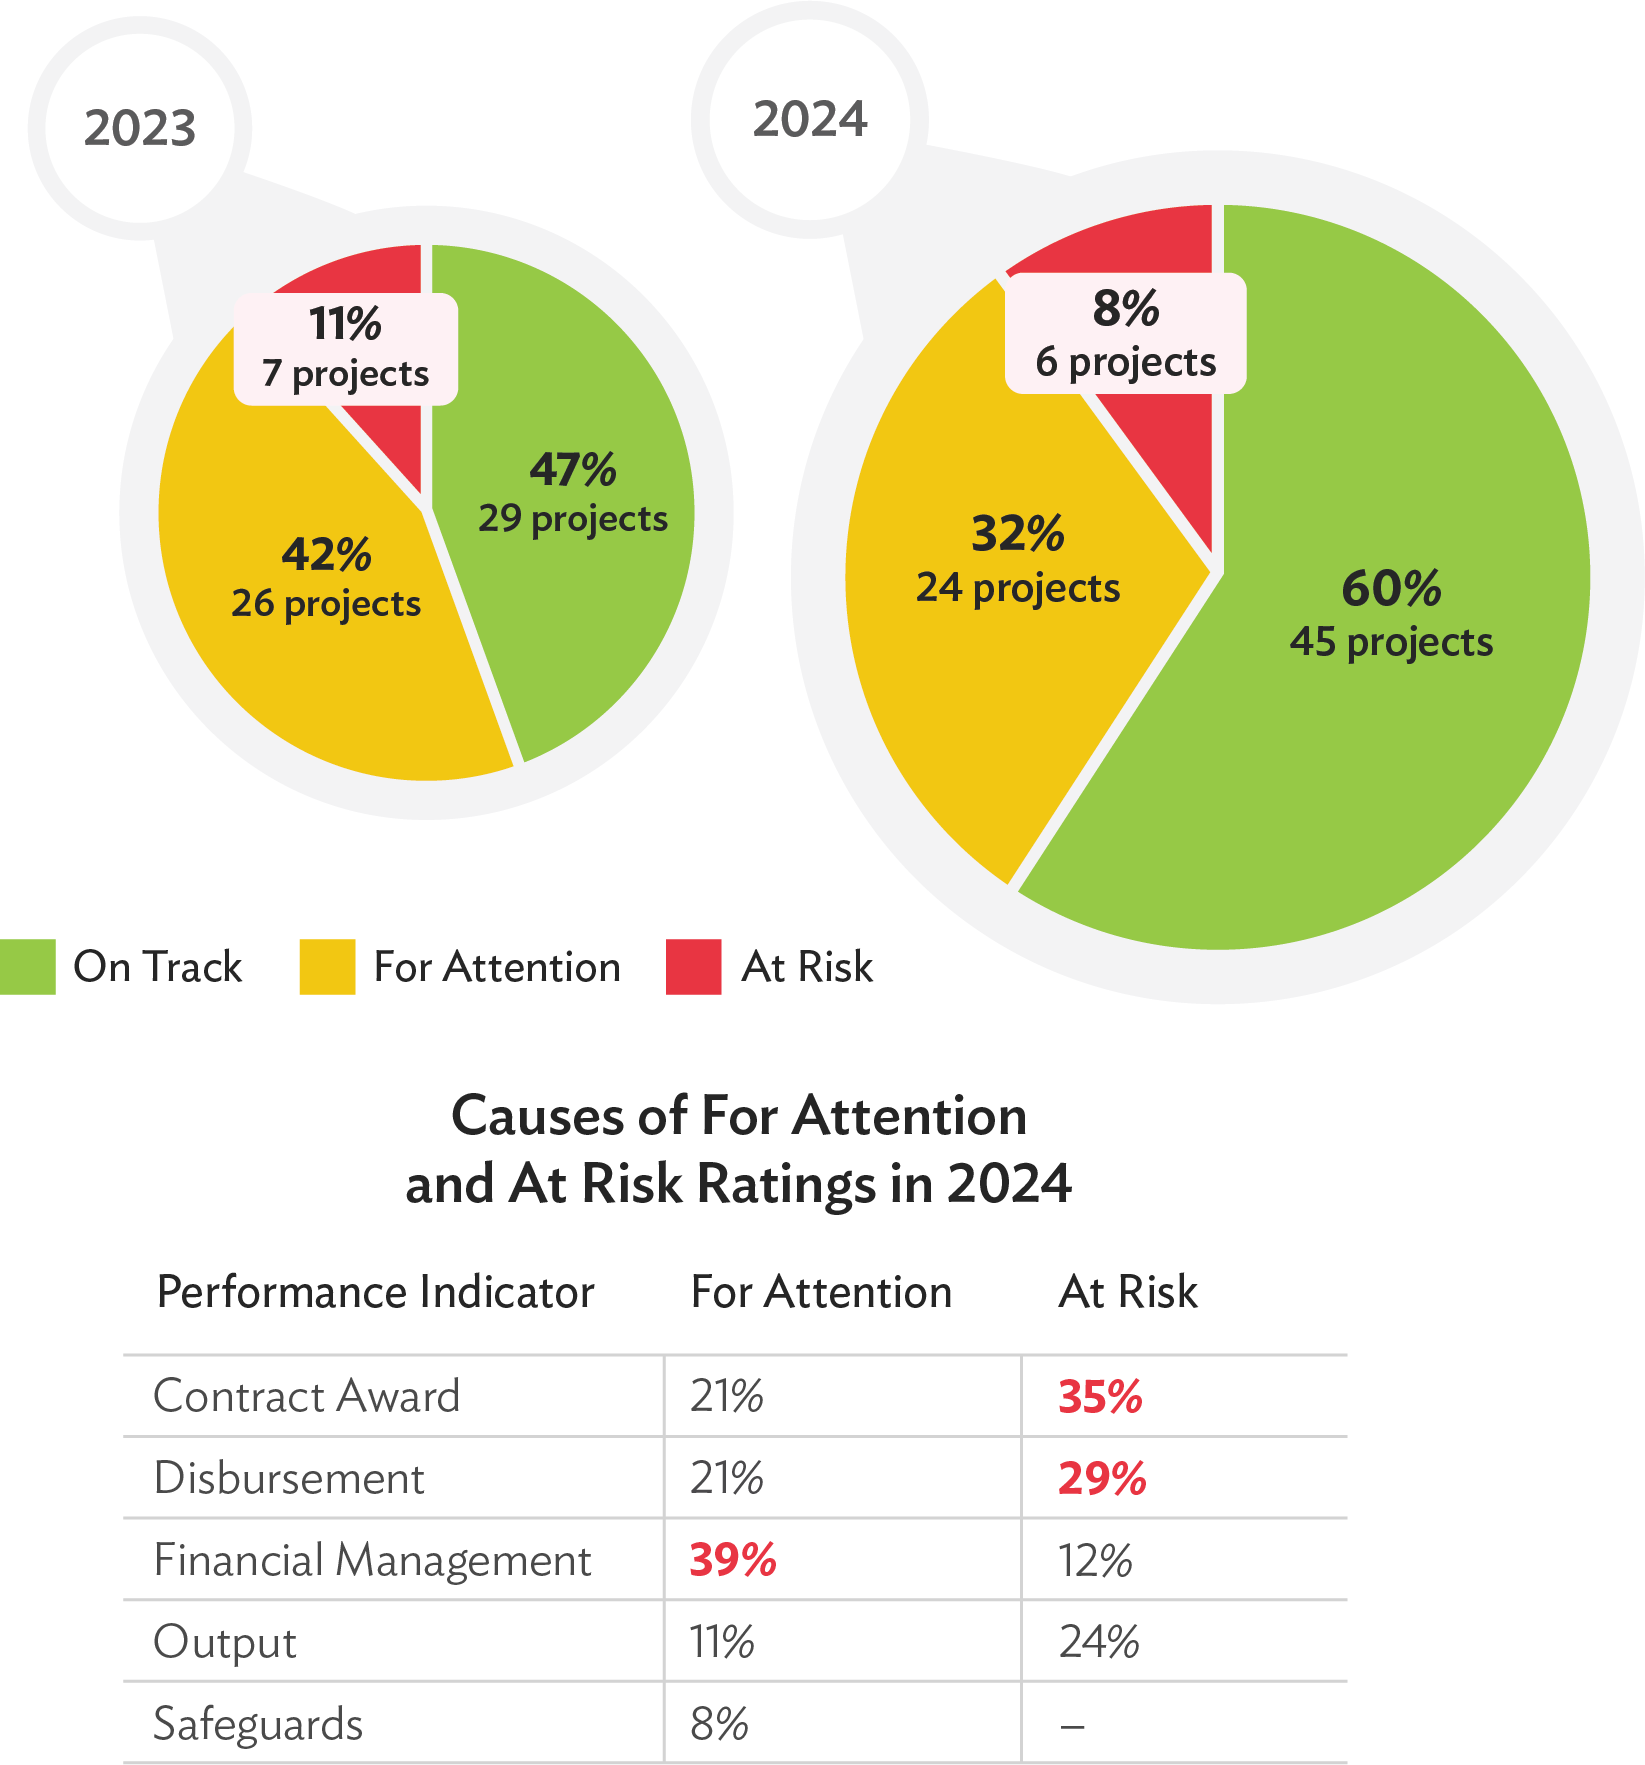
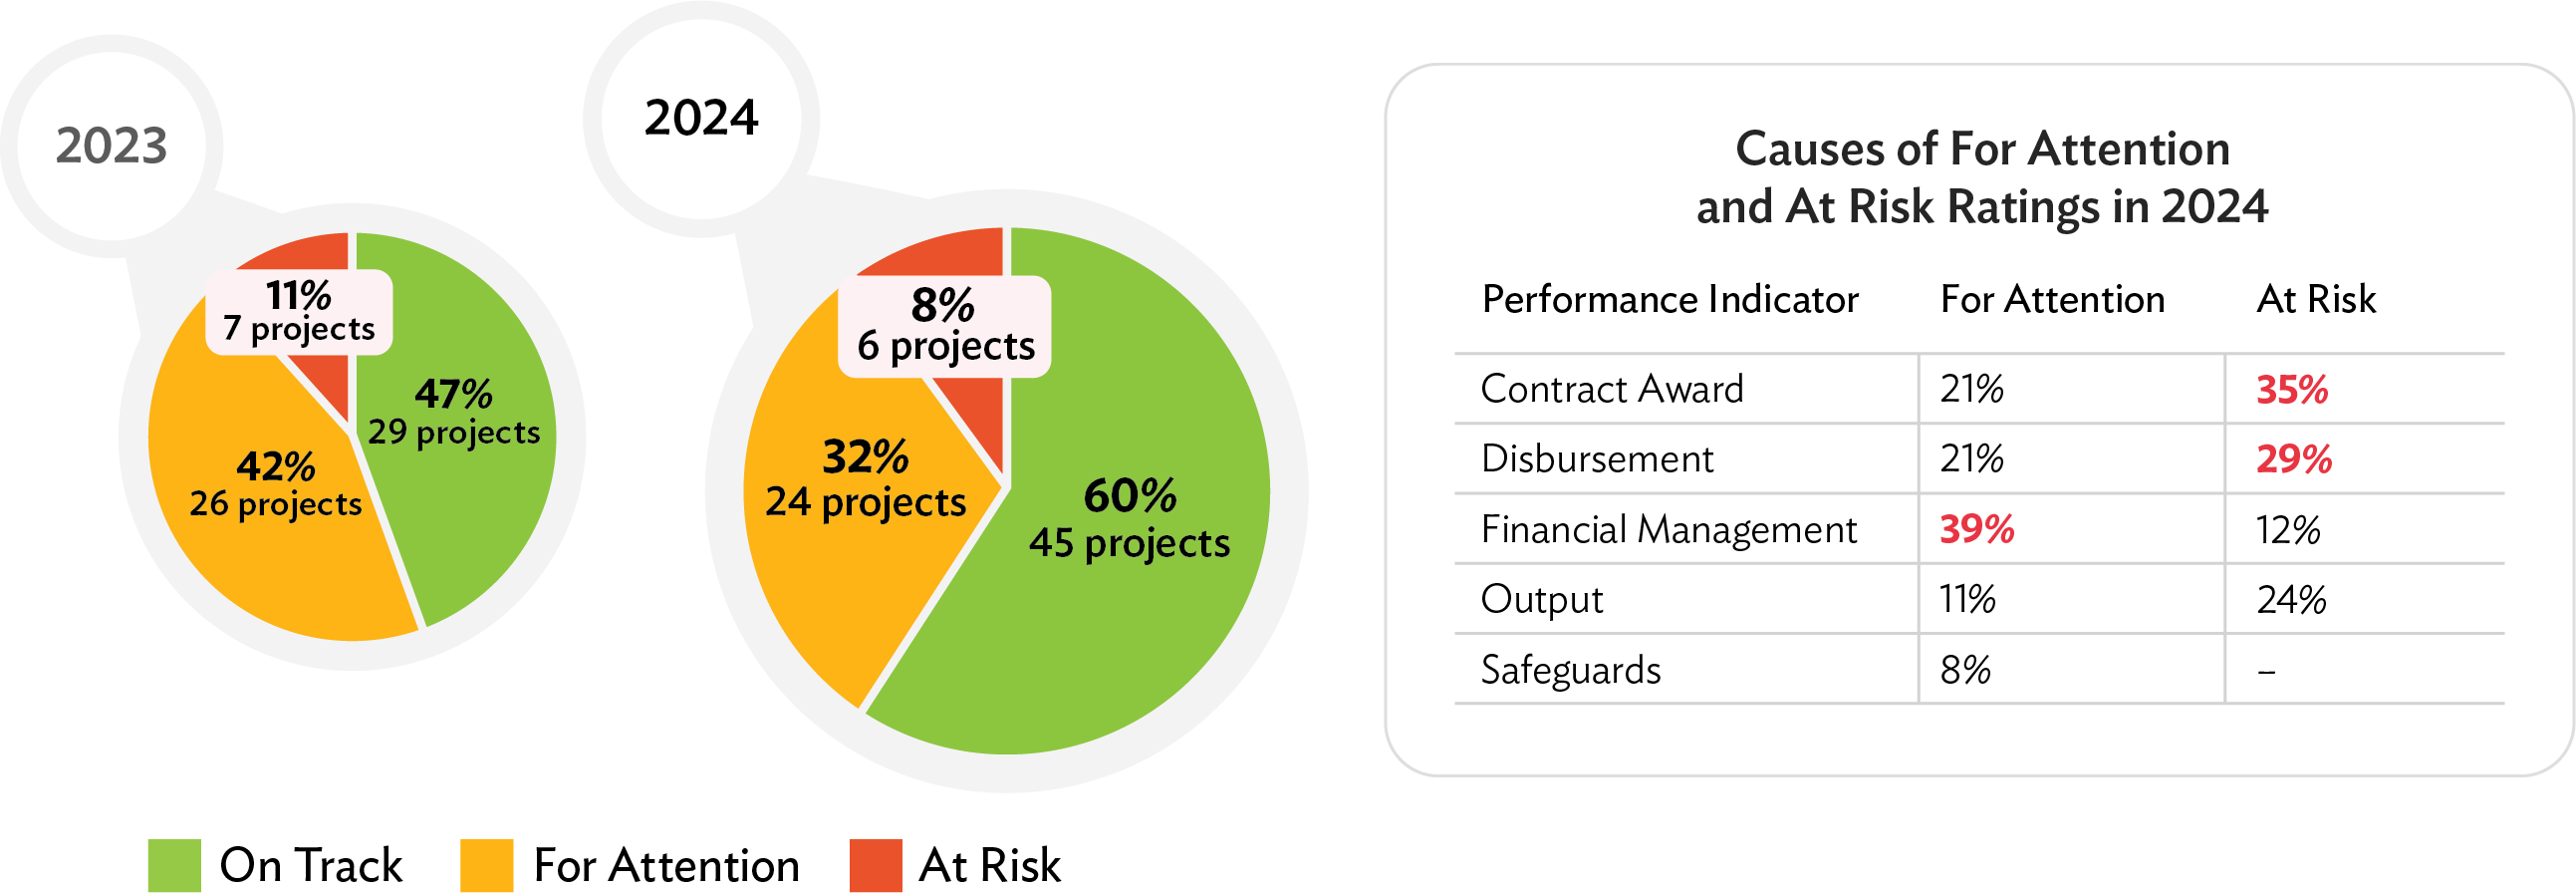
- 1.
Data excludes Afghanistan and Myanmar. Effective 1 February 2021, ADB placed a temporary hold on sovereign project disbursements and new contracts in Myanmar, but since 2023 has supported the people of Myanmar through a special arrangement with United Nations agencies to deliver humanitarian assistance. ADB placed its regular assistance to Afghanistan on hold effective 15 August 2021, but since 2022 has supported the Afghan people through a special arrangement with the United Nations to address basic human needs, including critical food support, and health and education services.
- 2.
In the table, “Causes of For Attention and At Risk Ratings,” percentages in column 2 are computed based on total issues reported across all performance indicators of projects rated for attention, and percentages in column 3 are determined based on total issues across all performance indicators of projects rated at risk. An “issue” is defined as a low rating of for attention or at risk in any of the five performance indicators.
2.SIDS Sovereign Portfolio
Increase in SIDS portfolio by 29%. The SIDS sovereign portfolio increased from $3.8 billion at the start of 2024 to $4.9 billion by year-end, an increase of $1.1 billion (29%) (Figure 12). 27 The increase is the net change between $1.3 billion in commitments versus closures of $0.2 billion.
Figure 12: SIDS Sovereign Portfolio at a Glance
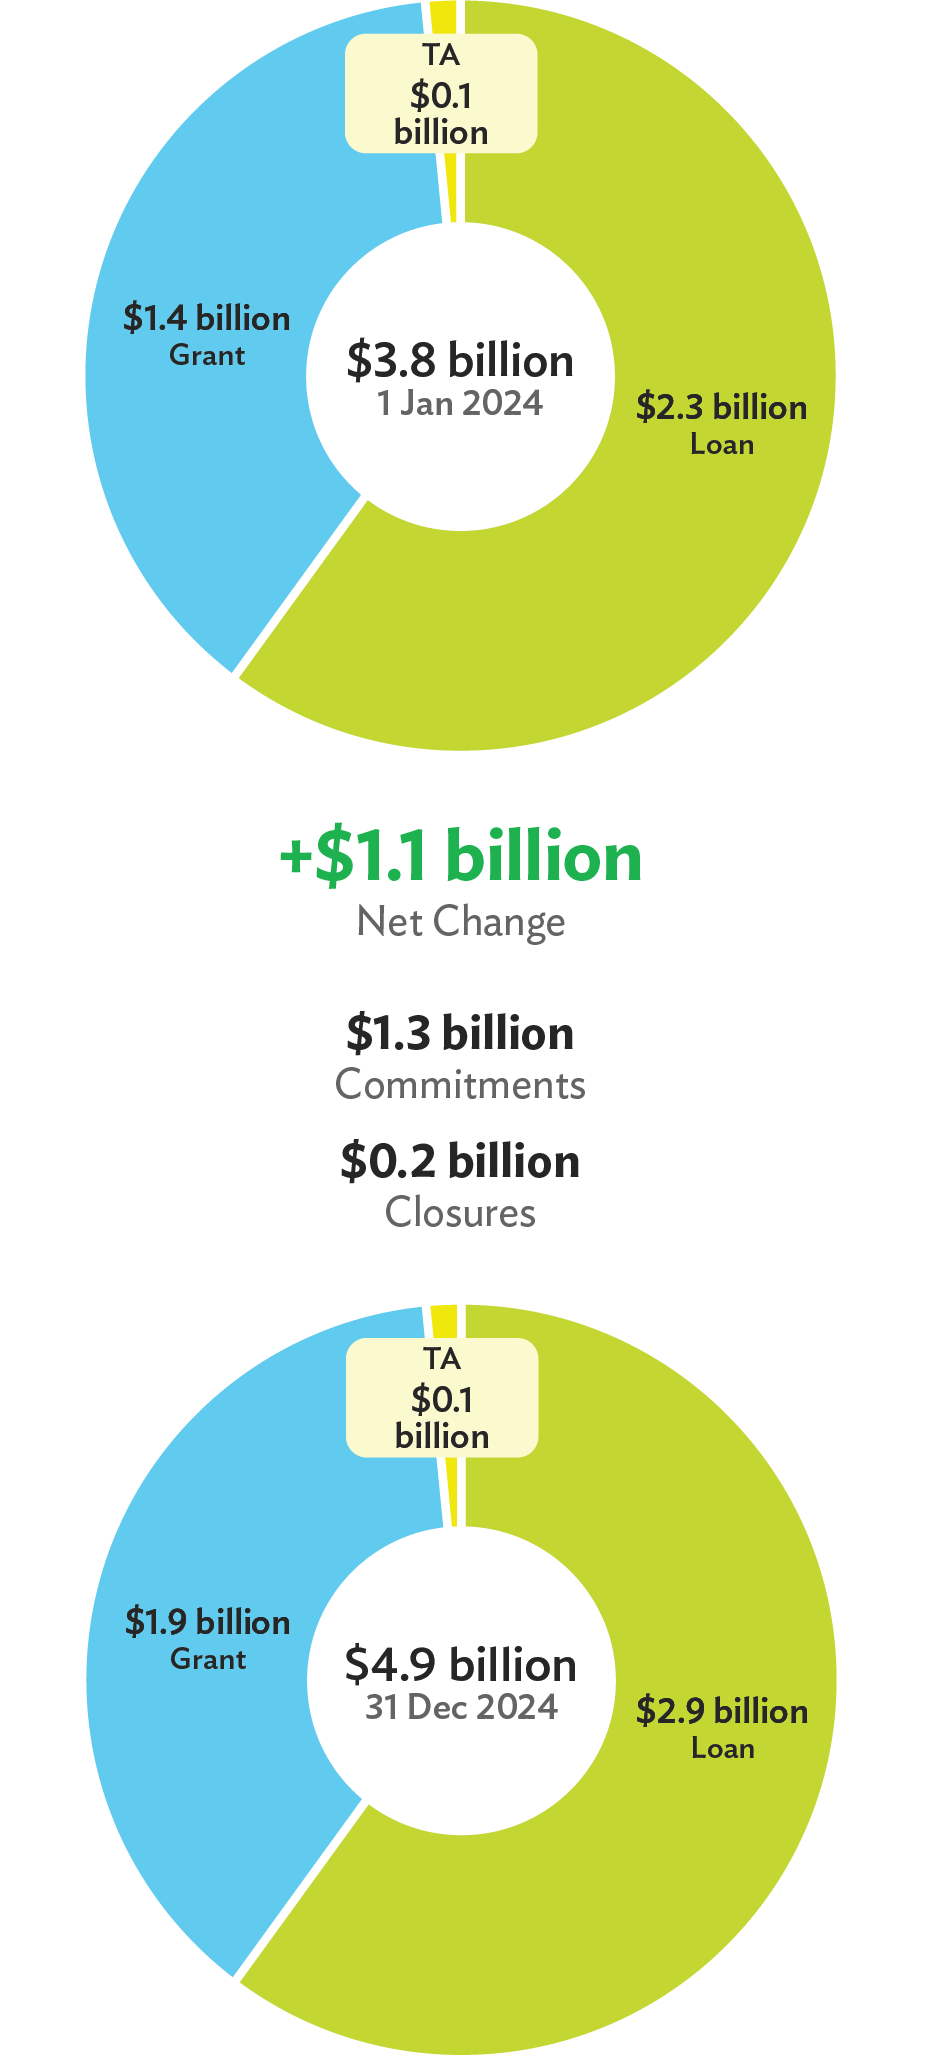
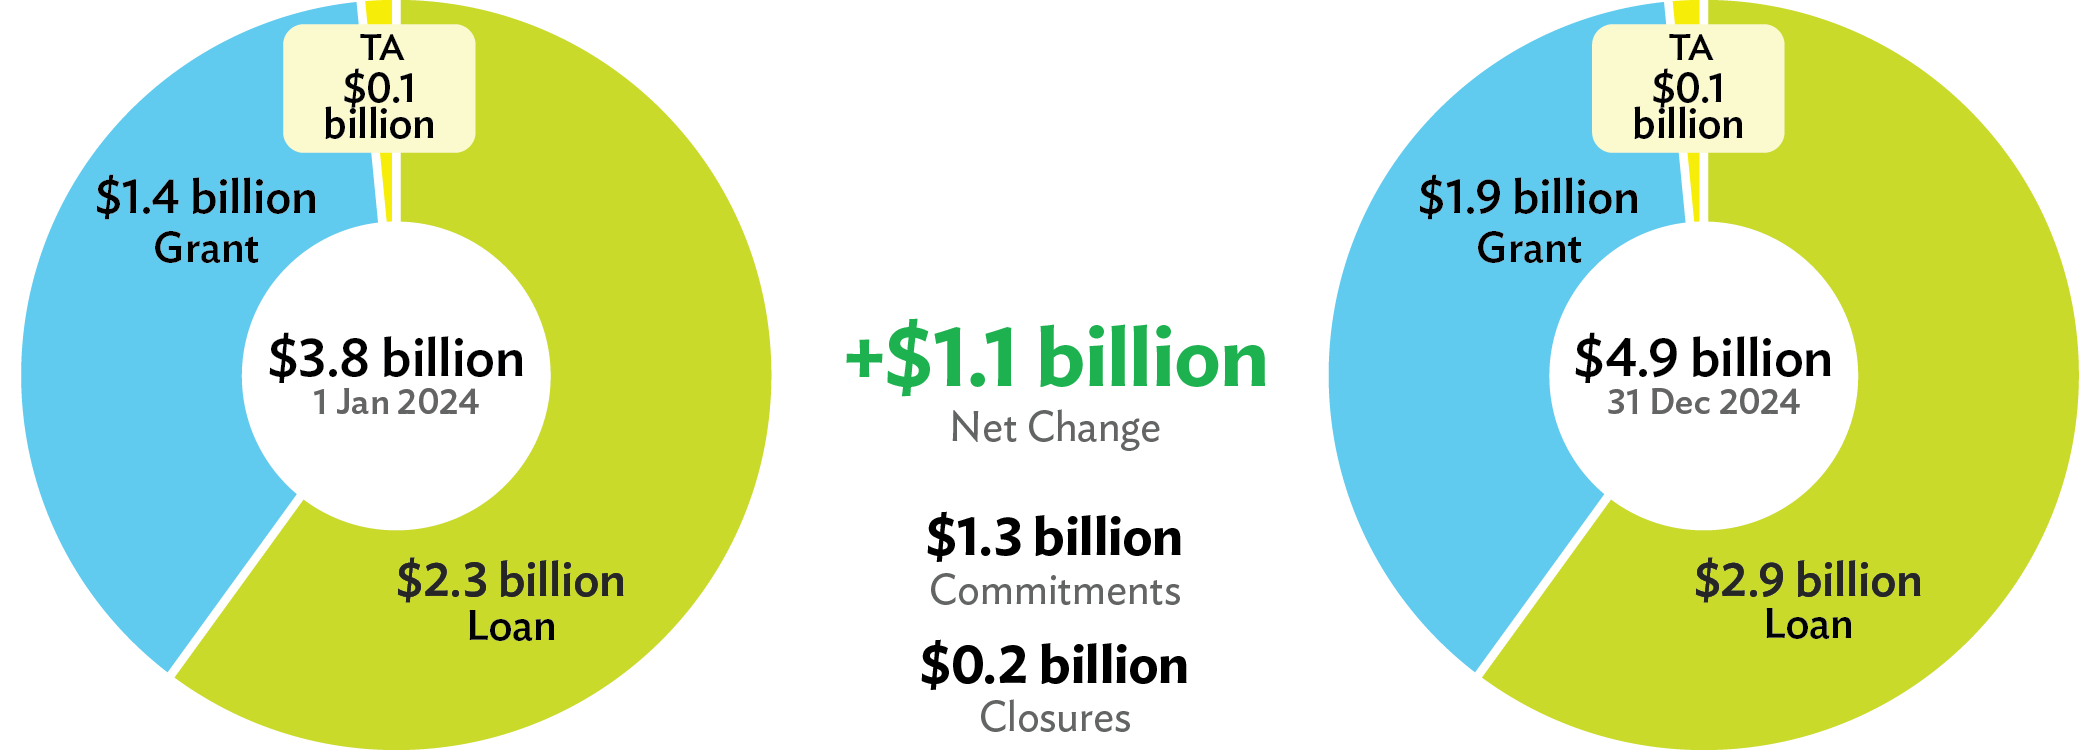
Figure 13: SIDS Portfolio by Sector
(active committed projects and technical assistance as of 31 December 2024,
in $ million)
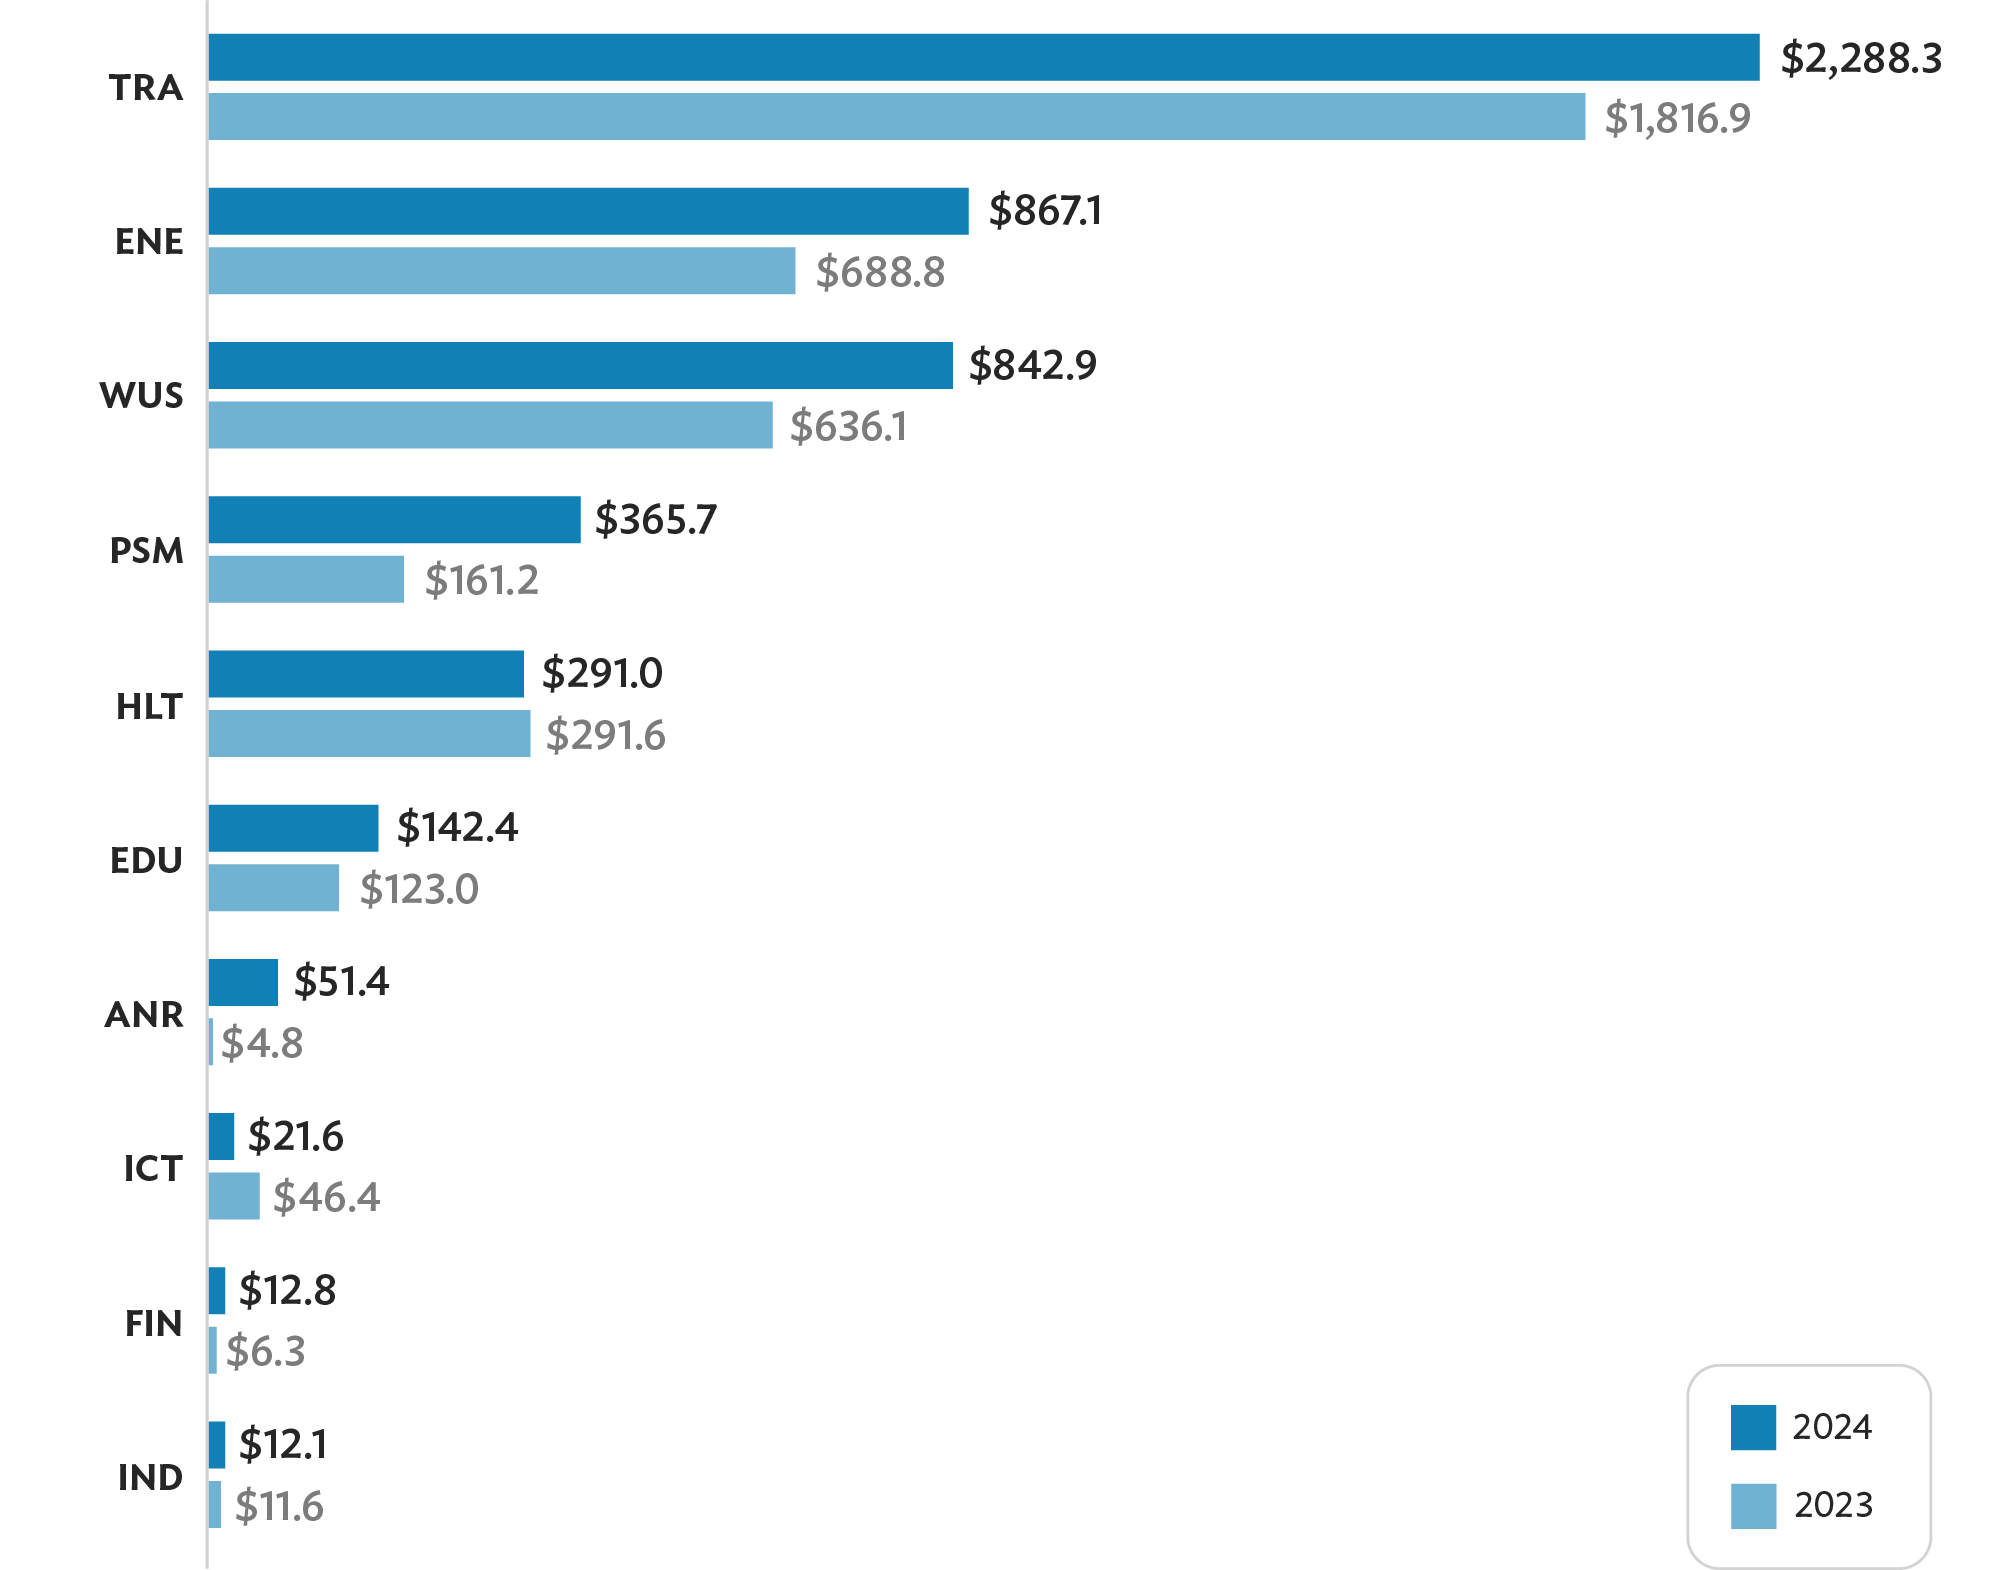
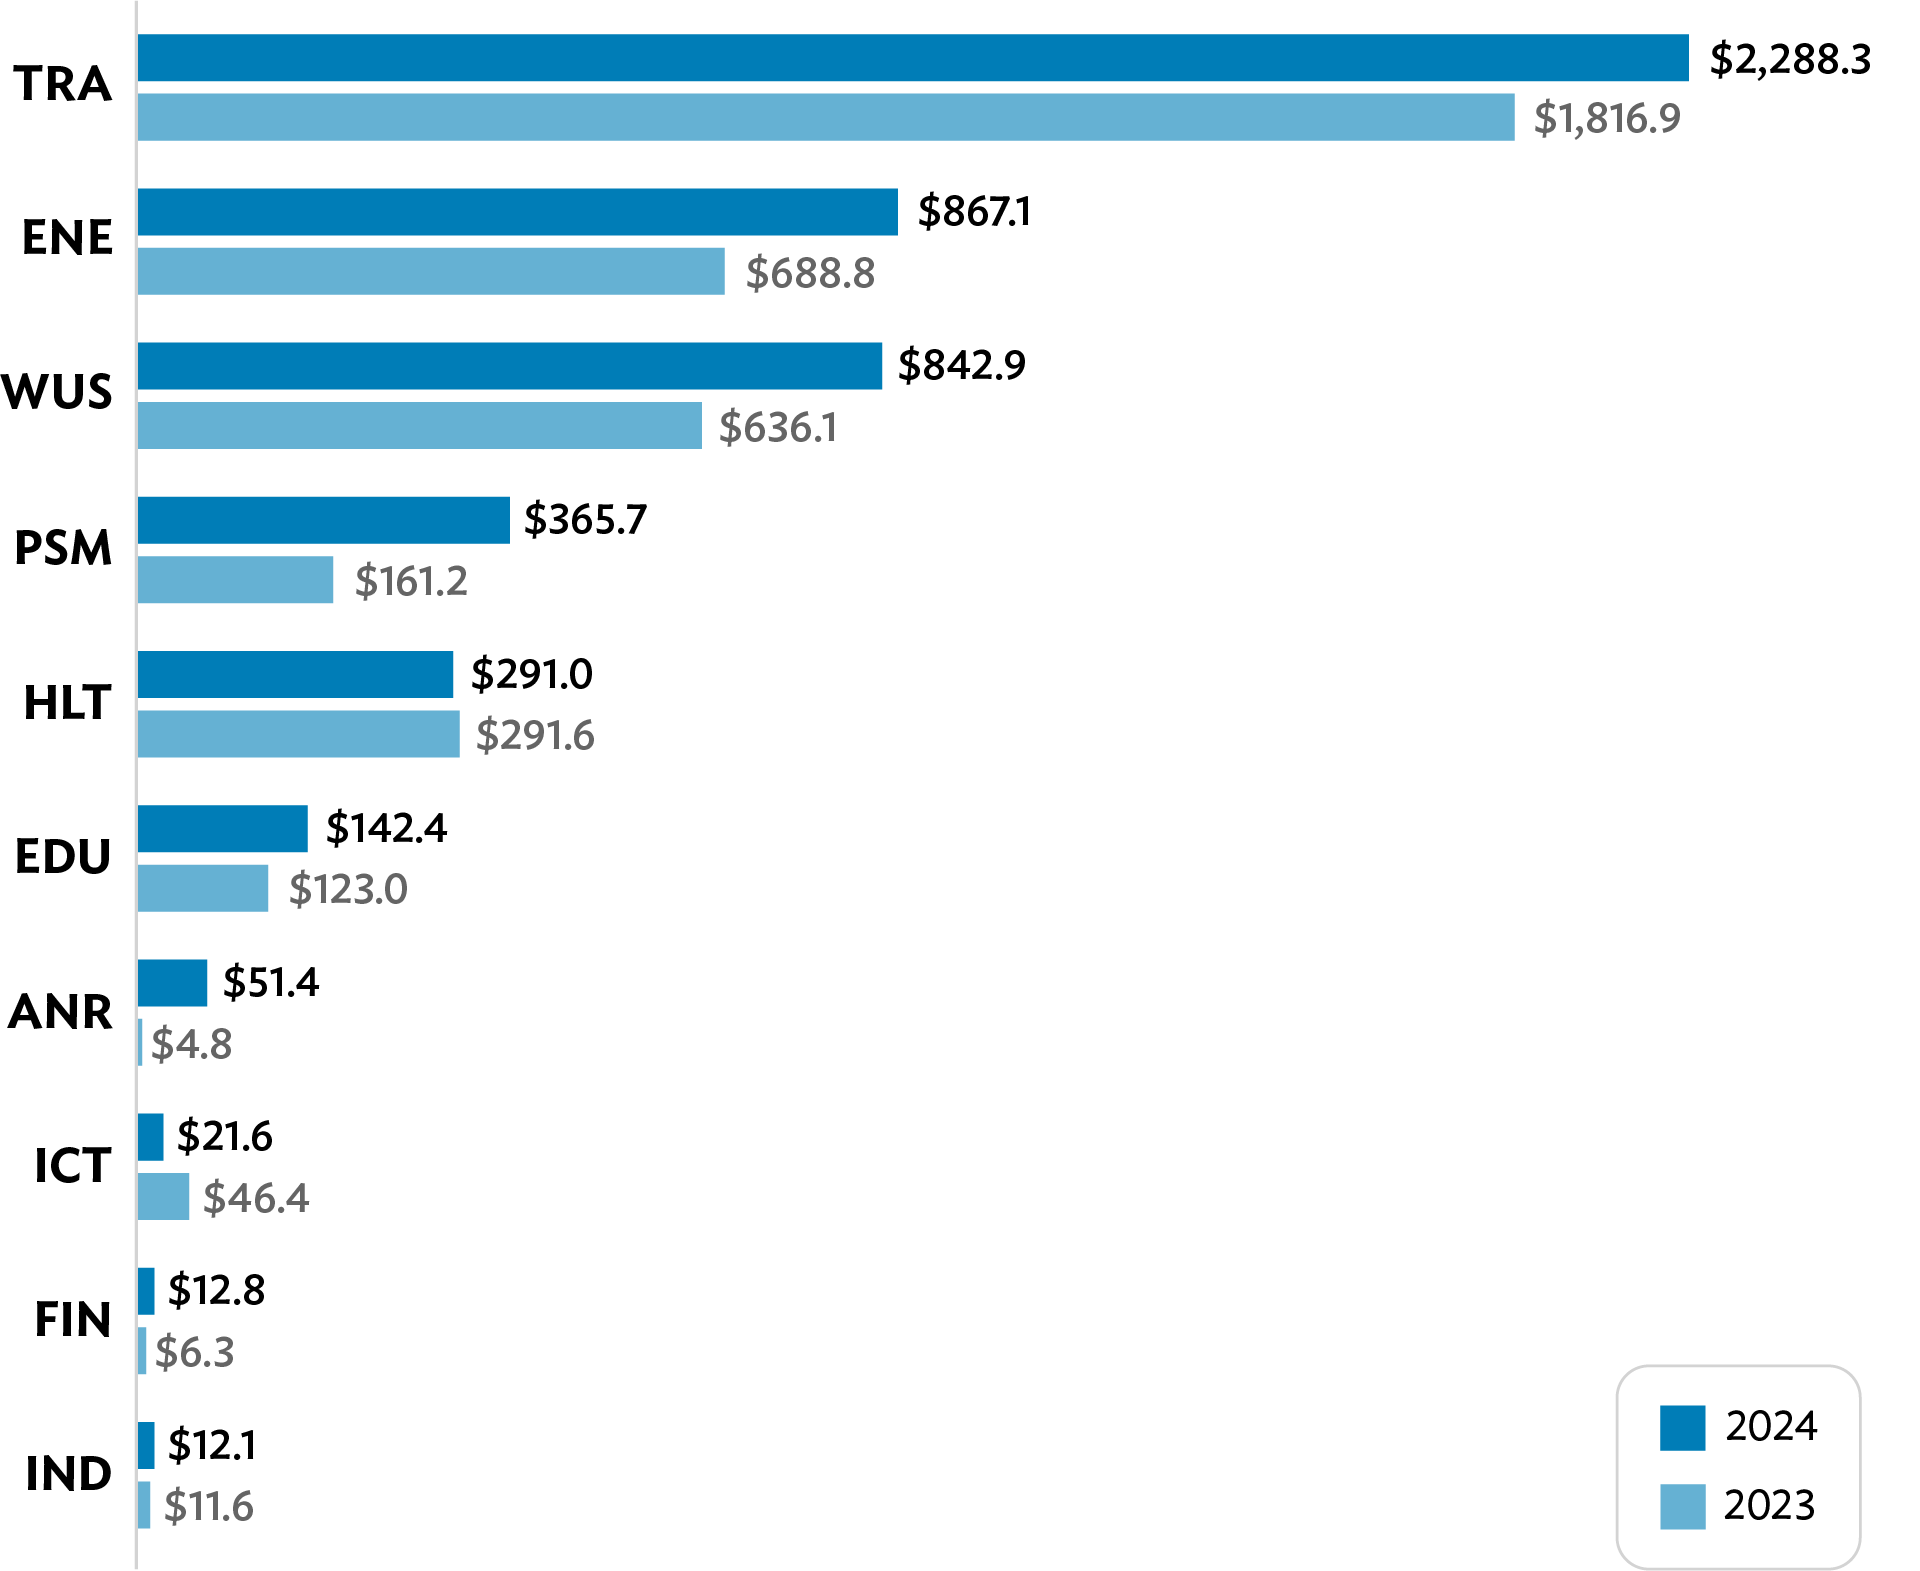
Sector breakdown. The transport ($2.3 billion), energy ($0.9 billion), and WUS ($0.8 billion) sectors accounted for almost 82% of the 2024 SIDS portfolio (Figure 13). The remainder of the portfolio is distributed among public sector management ($0.4 billion), health ($0.3 billion), and education ($0.1 billion). The increase in the SIDS portfolio from $3.8 billion at the start of the year to $4.9 billion by year end was driven by transport (net increase of $471.4 million), WUS (net increase of $206.8 million), public sector management (net increase of $204.5 million), and energy (net increase of $178.8 million).
Country breakdown. The largest shares of the 2024 SIDS portfolio by volume belonged to PNG ($1.8 billion), Timor-Leste ($0.6 billion), Solomon Islands ($0.4 billion), Fiji ($0.3 billion), Maldives ($0.3 billion), Samoa ($0.2 billion), Tonga ($0.2 billion), Vanuatu ($0.2 billion), and Kiribati ($0.2 billion) (Figure 14). Among SIDS, the largest portfolio increases in 2024 were in PNG (net increase of $359.2 million), Solomon Islands ($144.0 million), Fiji ($136.8 million), Samoa ($108.0 million), and the Marshall Islands ($101.7 million).
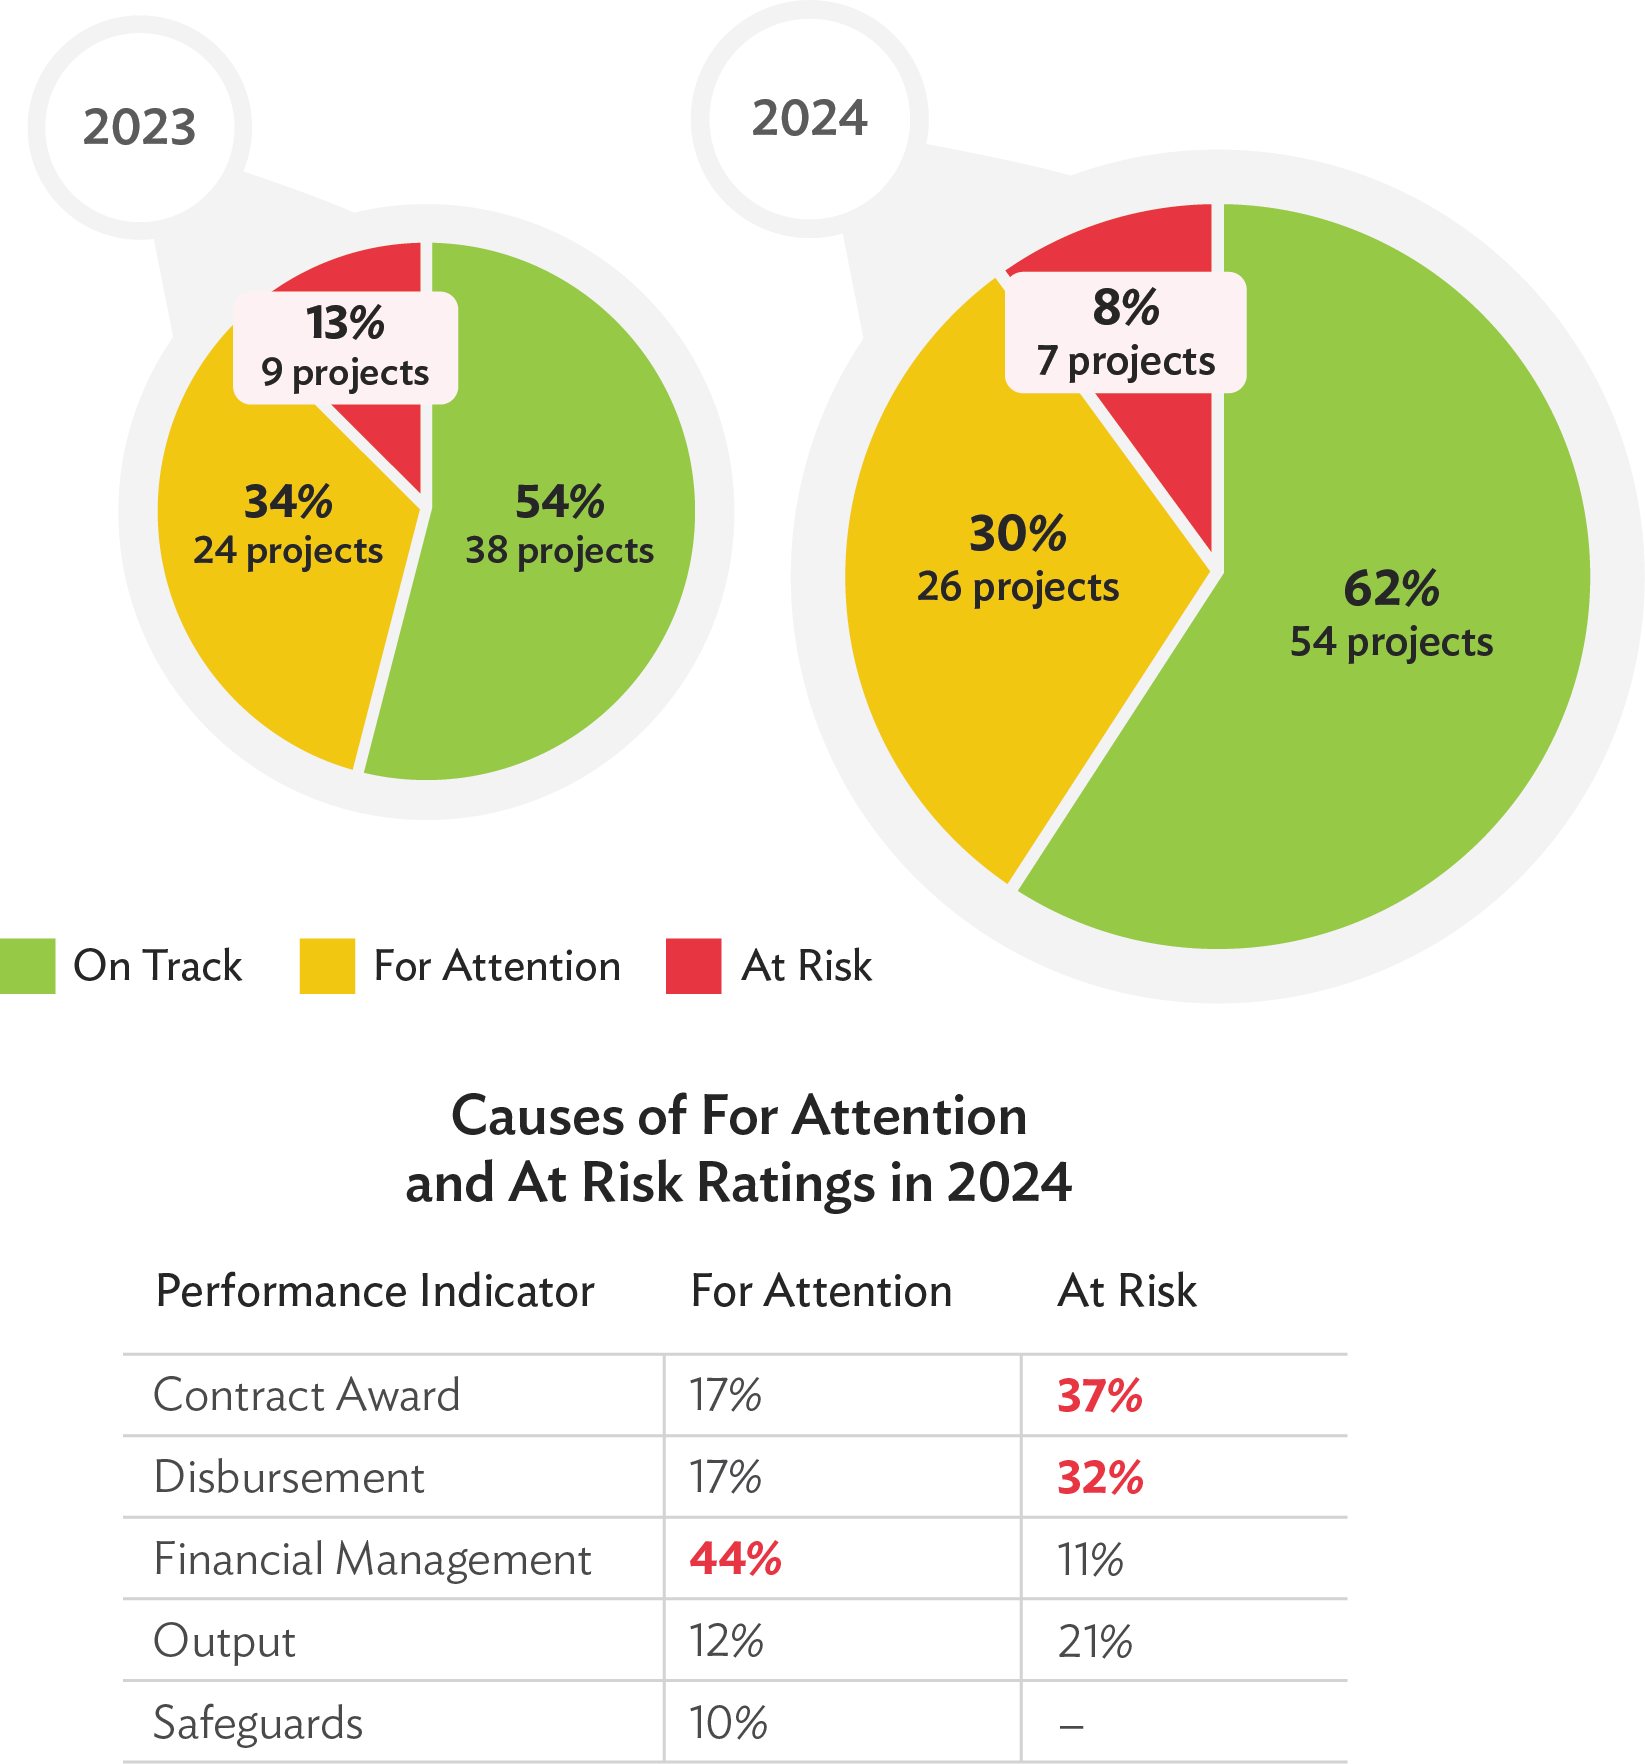
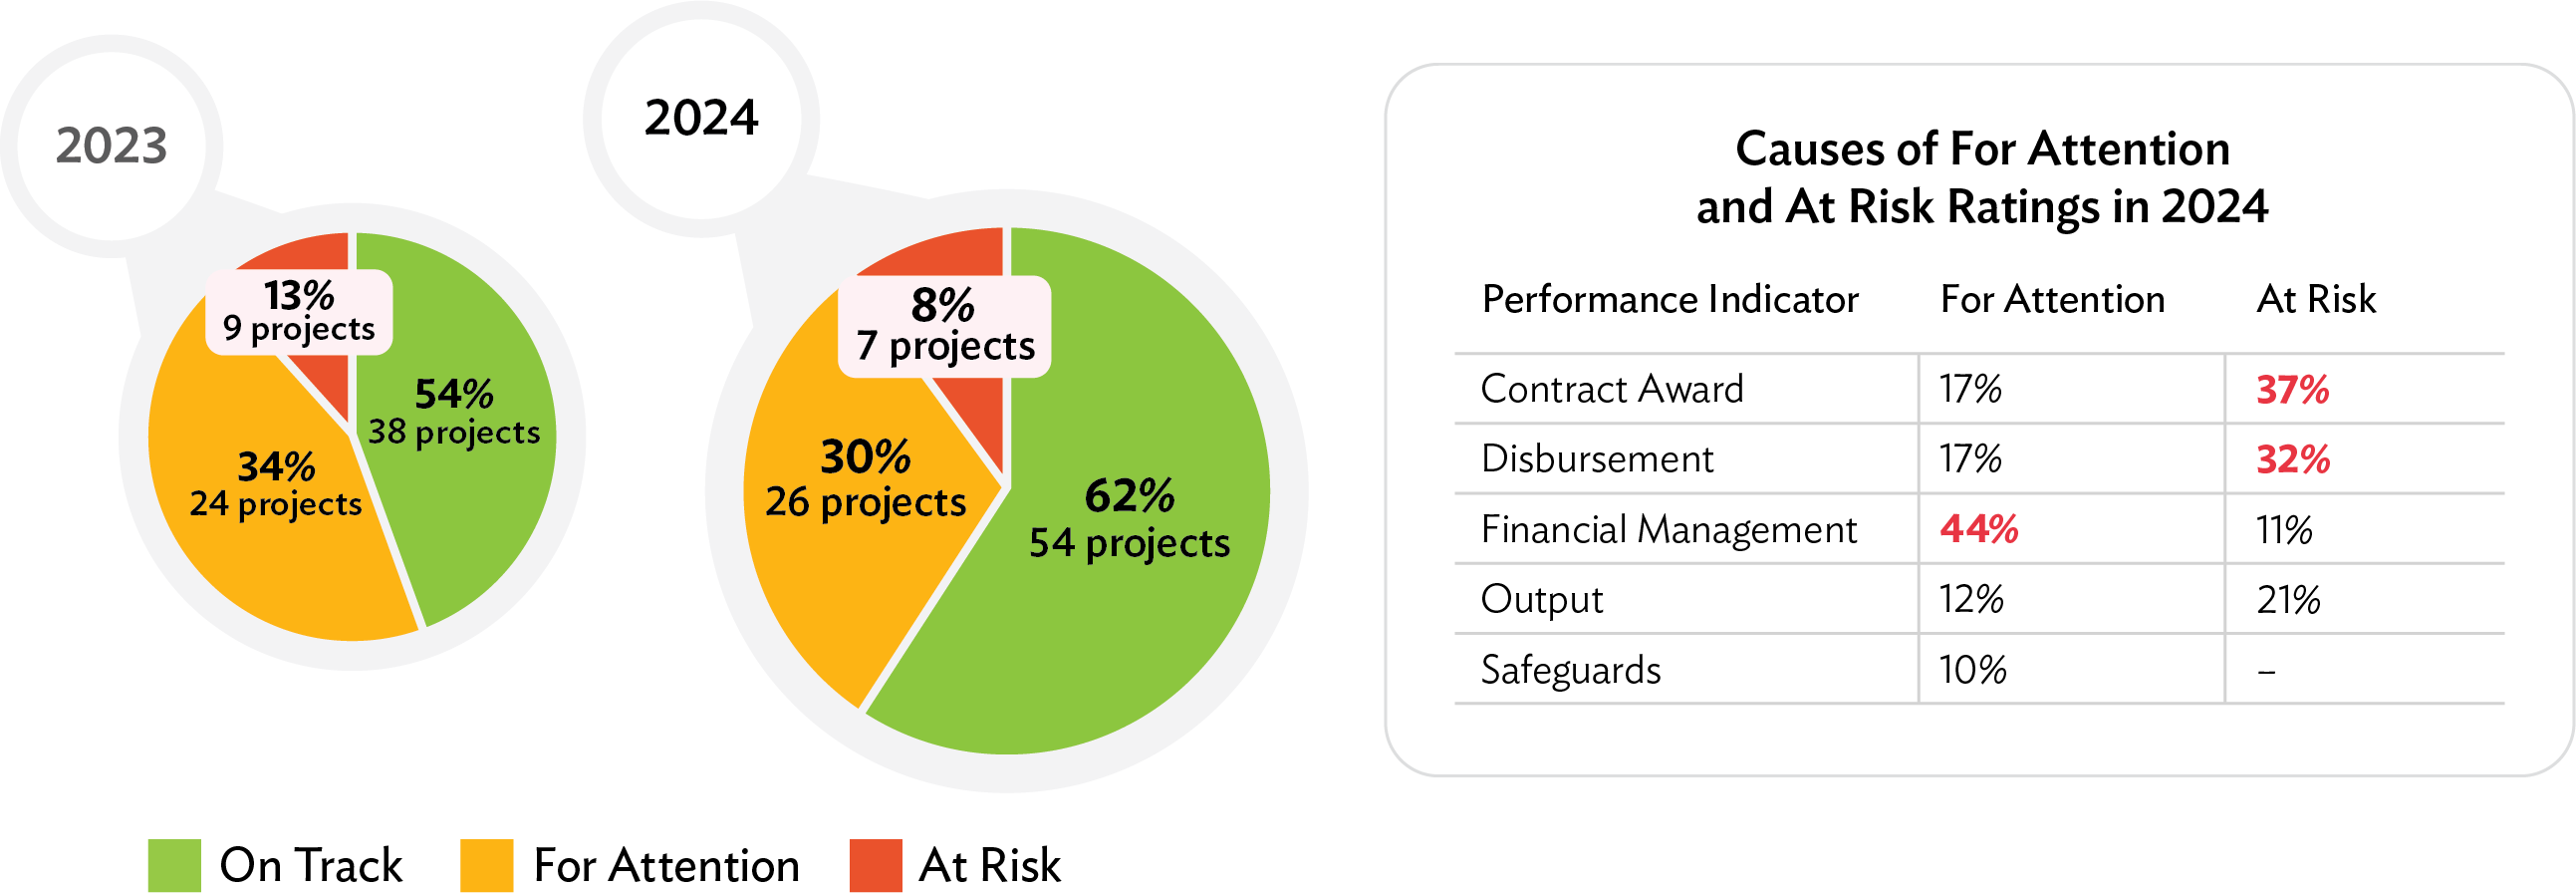
Improved SIDS project portfolio performance. As of the end of 2024, 62% of ongoing projects in SIDS (54 out of 87 projects) were rated on track, which is an improvement from 54% in 2023 (Figure 15). Similarly to FCAS-classified DMCs, the improved performance is attributed to SIDS’ recovery from the COVID-19 pandemic. Projects rated for attention decreased to 30% in 2024 from 34% in 2023, while projects rated at risk declined to 8% from 13%.
Figure 14: SIDS Portfolio by Country
(active committed projects and technical assistance as of 31 December 2024,
in $ million)
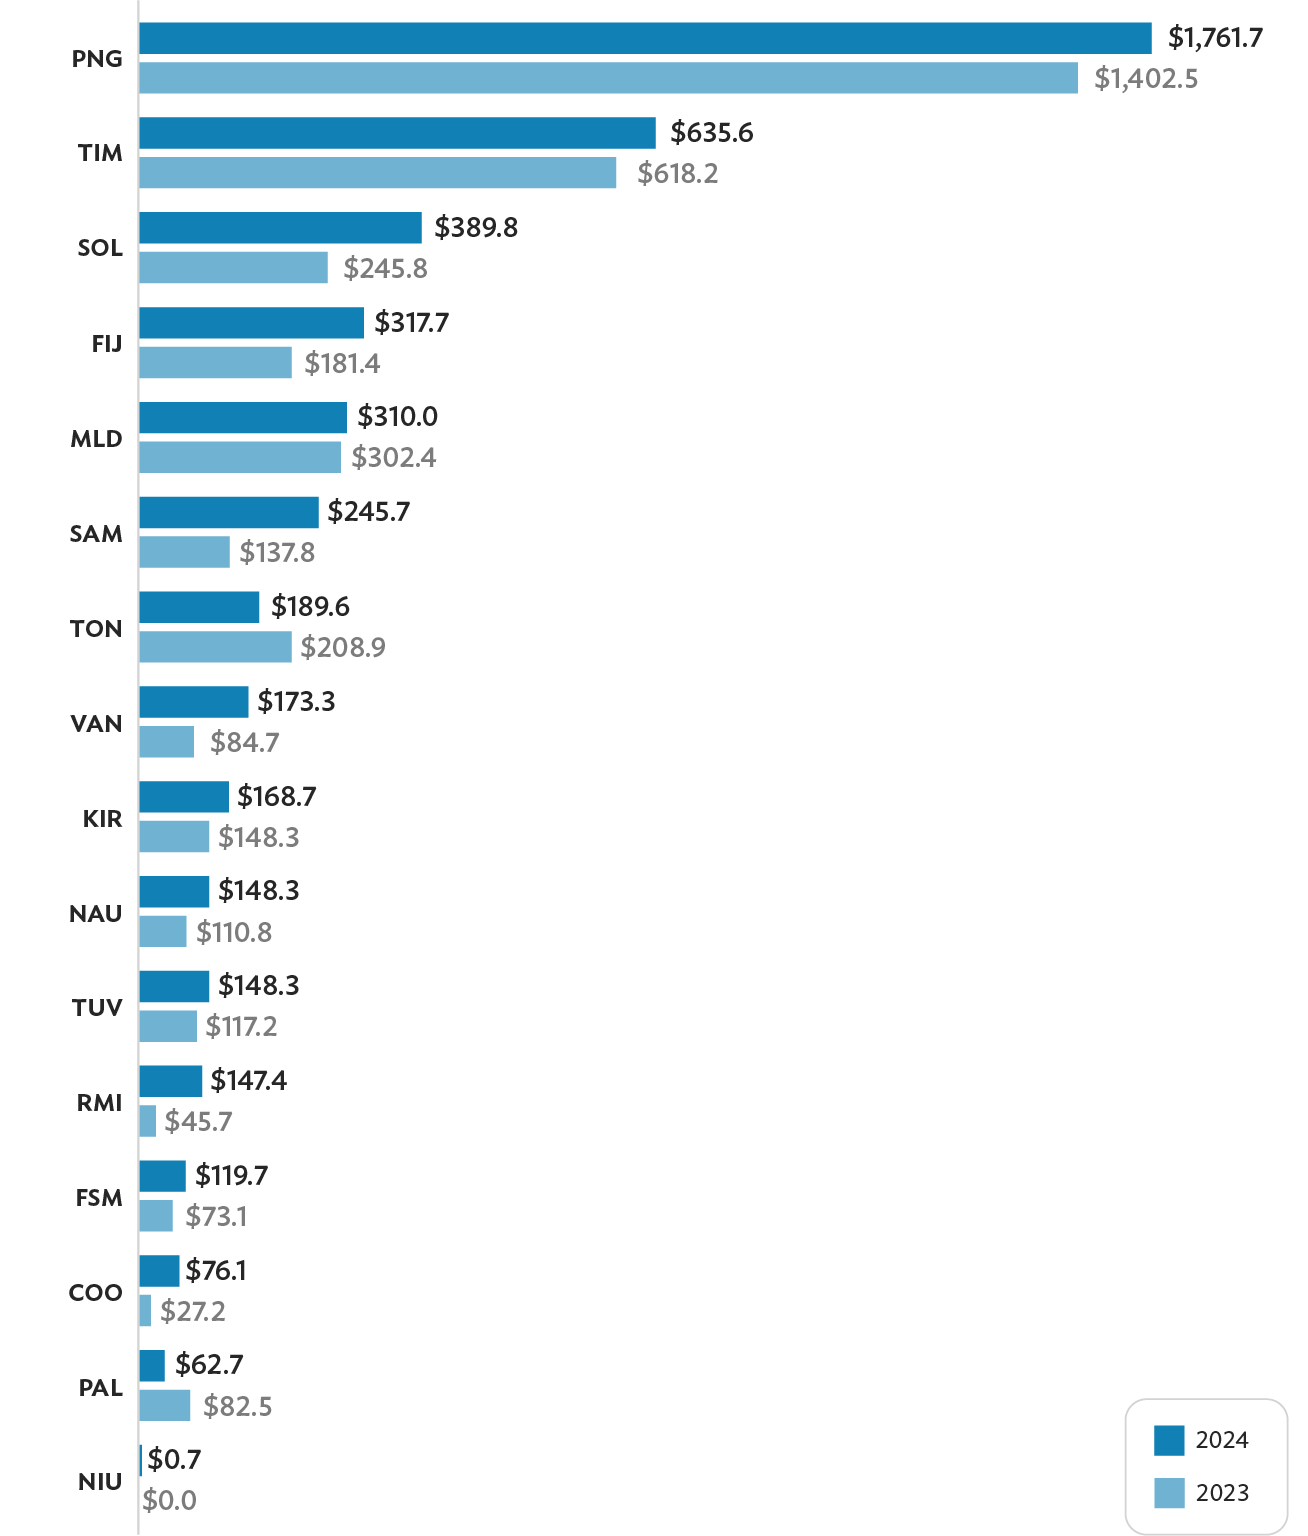
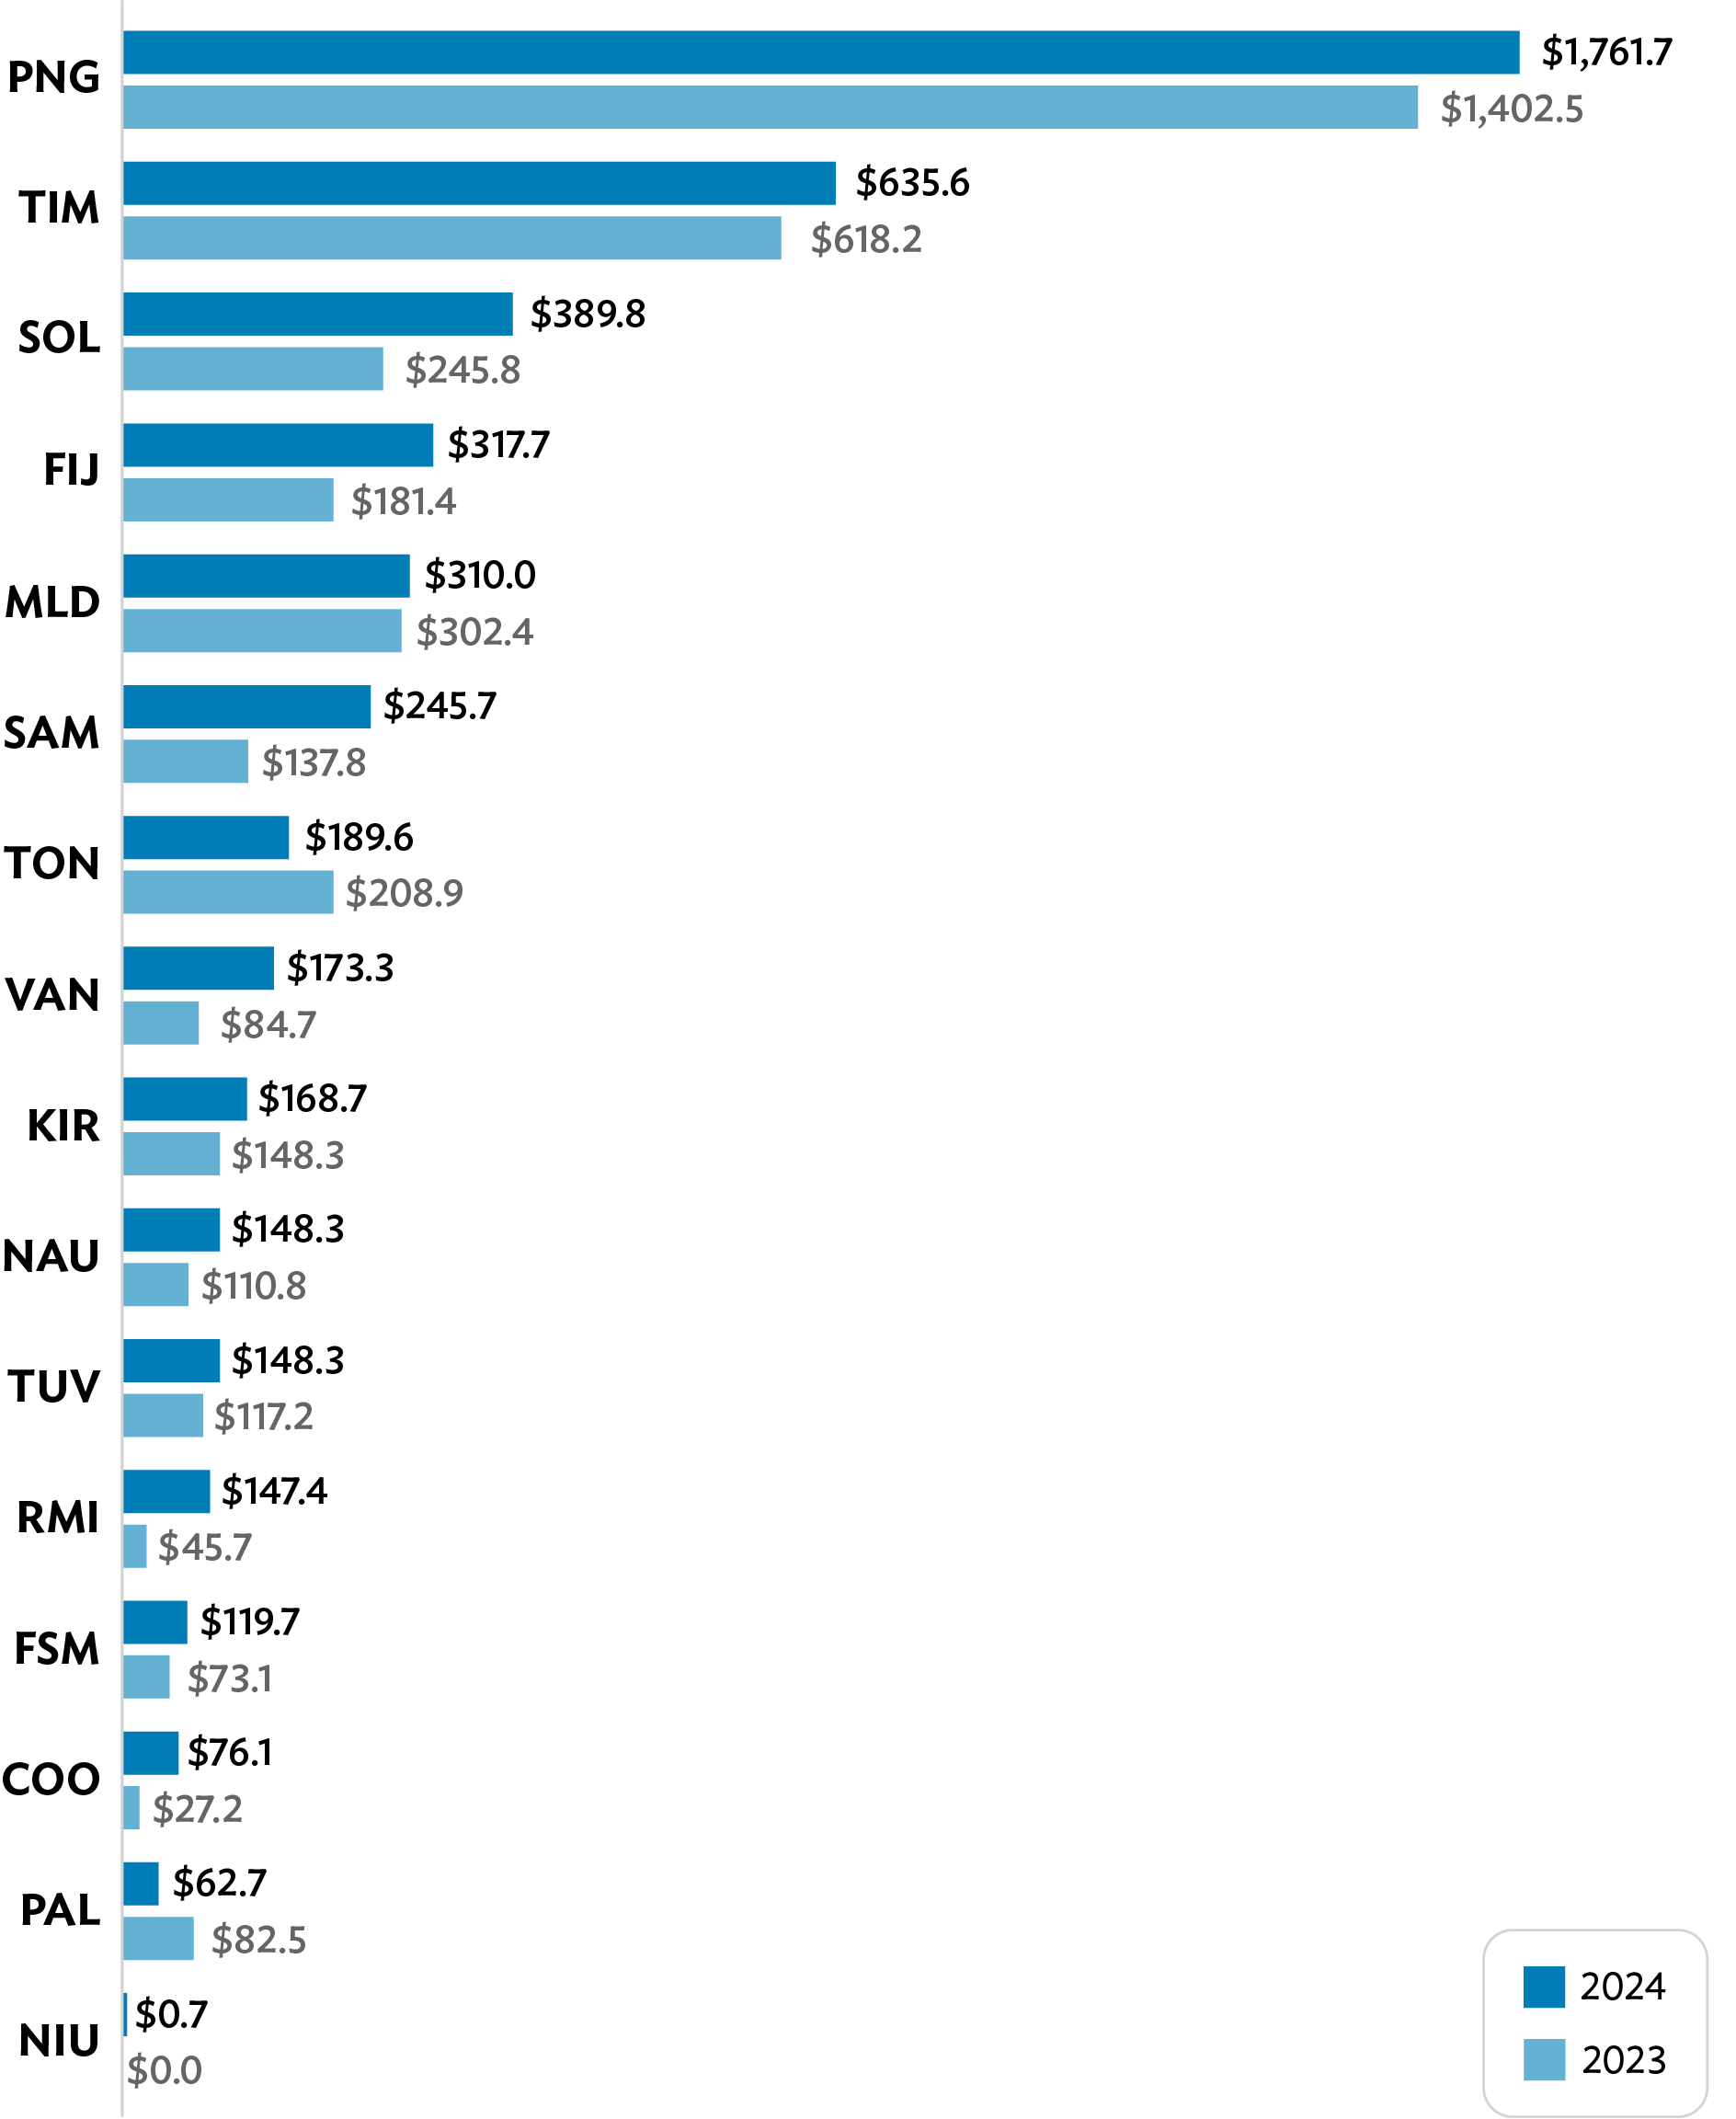
SAM = Samoa, SOL = Solomon Islands, TIM = Timor-Leste, TON = Tonga,
TUV = Tuvalu, VAN = Vanuatu. Source: Asian Development Bank.
Financial management issues accounted for 44% of total reported issues in projects rated for attention. Delays were generally caused by late submission of project financial statements or delays in completion of audits. In addition, the severe earthquake experienced by Vanuatu in December 2024 delayed finalization of several audit reports that were scheduled to be signed and submitted by year-end.
Meanwhile, common issues for projects receiving an at risk rating were low contract award (37%) and low disbursement (32%). Most of these projects were in Timor-Leste.
Figure 15: SIDS Project Performance Ratings
- 1.
In the table, “Causes of For Attention and At Risk Ratings,” percentages in column 2 are computed based on total issues reported across all performance indicators of projects rated for attention, and percentages in column 3 are determined based on total issues across all performance indicators of projects rated at risk.
- 2.
An “issue” is defined as a low rating of for attention or at risk in any of the five performance indicators.
3.FCAS and SIDS
Nonsovereign Portfolio
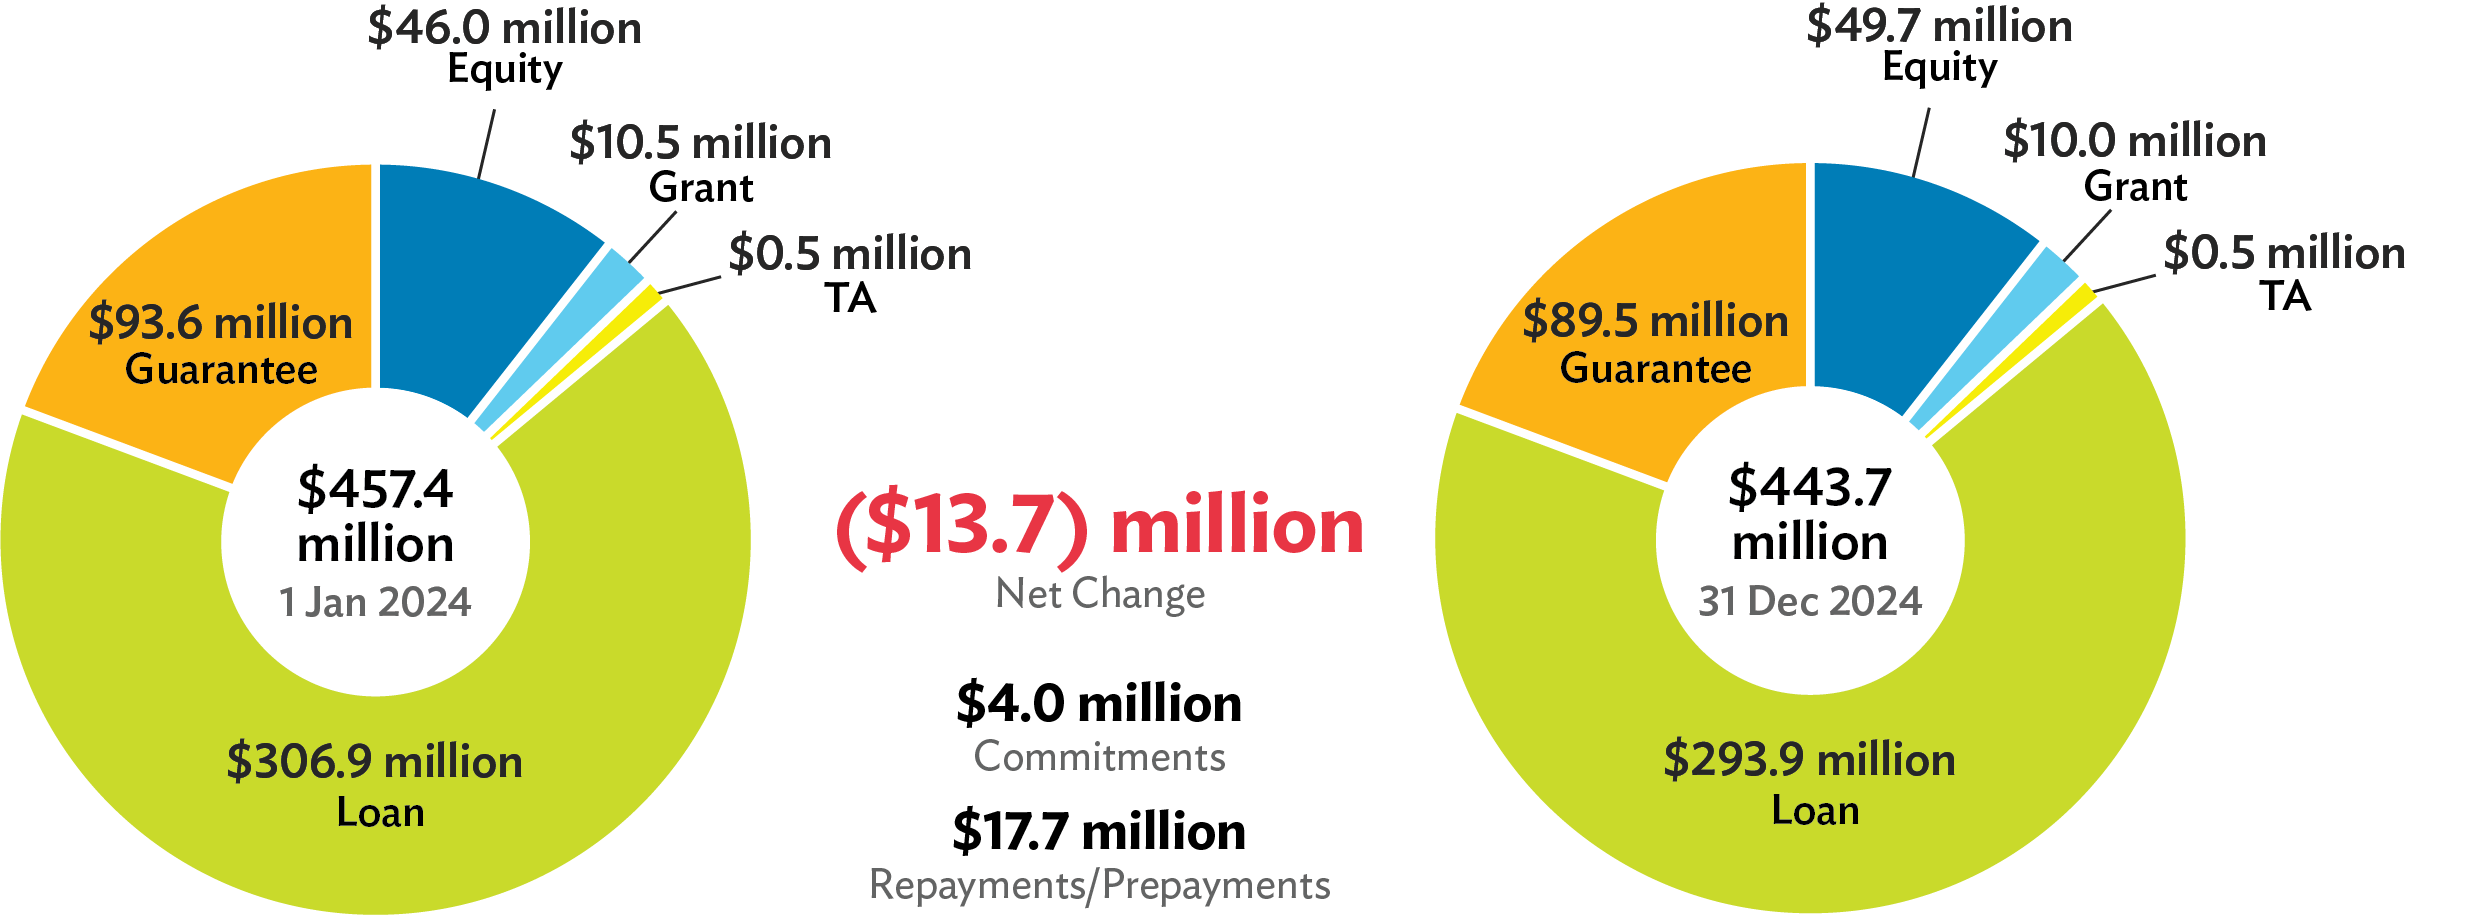
Nonsovereign portfolio down 3%. The FCAS and SIDS nonsovereign portfolio decreased by 3%, from $457.4 million at the beginning of the year to $443.7 million at year-end 2024, reflecting $4.0 million in total commitments over the course of the year versus $17.7 million in repayments/cancellations (Figure 16). 28
Figure 16: FCAS and SIDS Nonsovereign Portfolio at a Glance
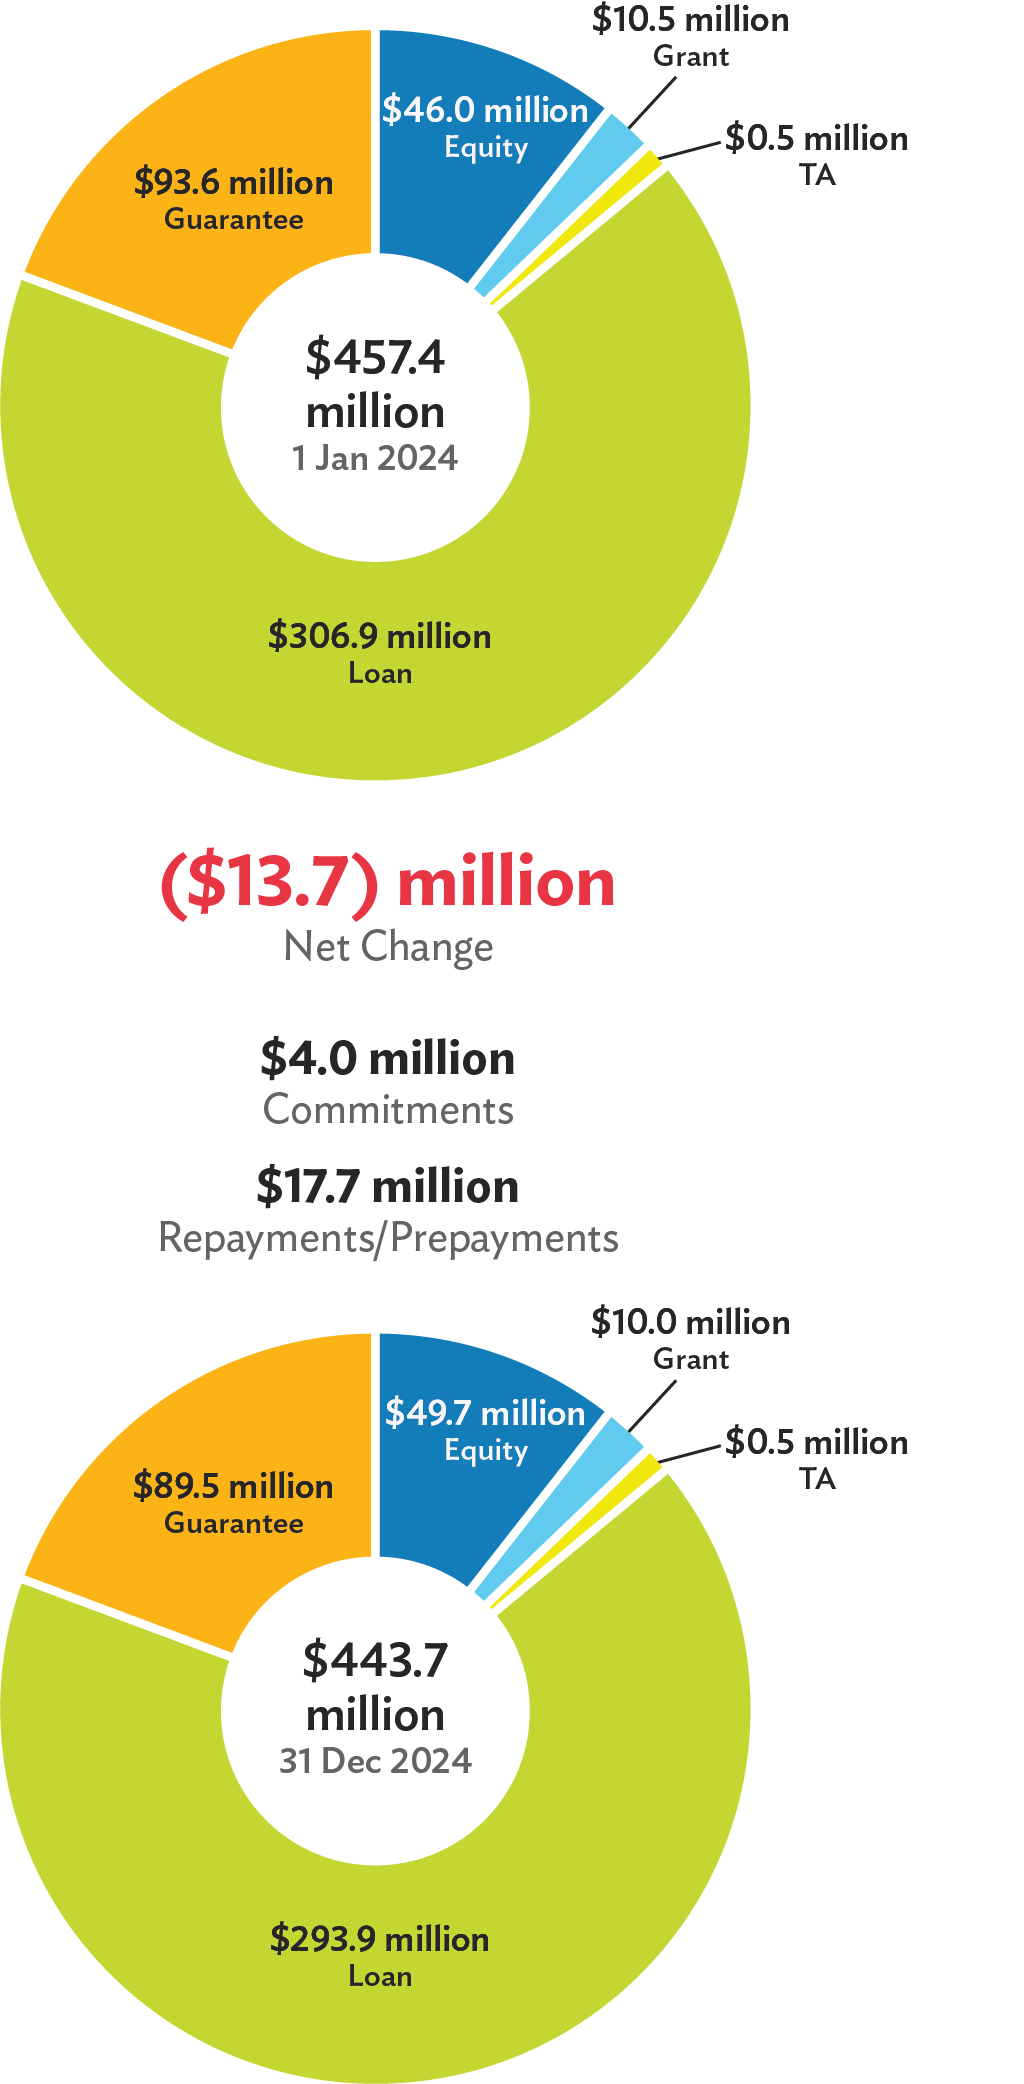
In 2024, ADB committed a nonsovereign project in Fiji. ADB’s financing to Merchant Finance Pte Limited will increase its capacity to finance underserved small and medium-sized enterprises (SMEs), especially those owned by women. The transaction is ADB’s first nonsovereign transaction in the finance sector in Fiji in local currency and its first use of funds from We-Fi (Women Entrepreneurs Finance Initiative) in the Pacific.
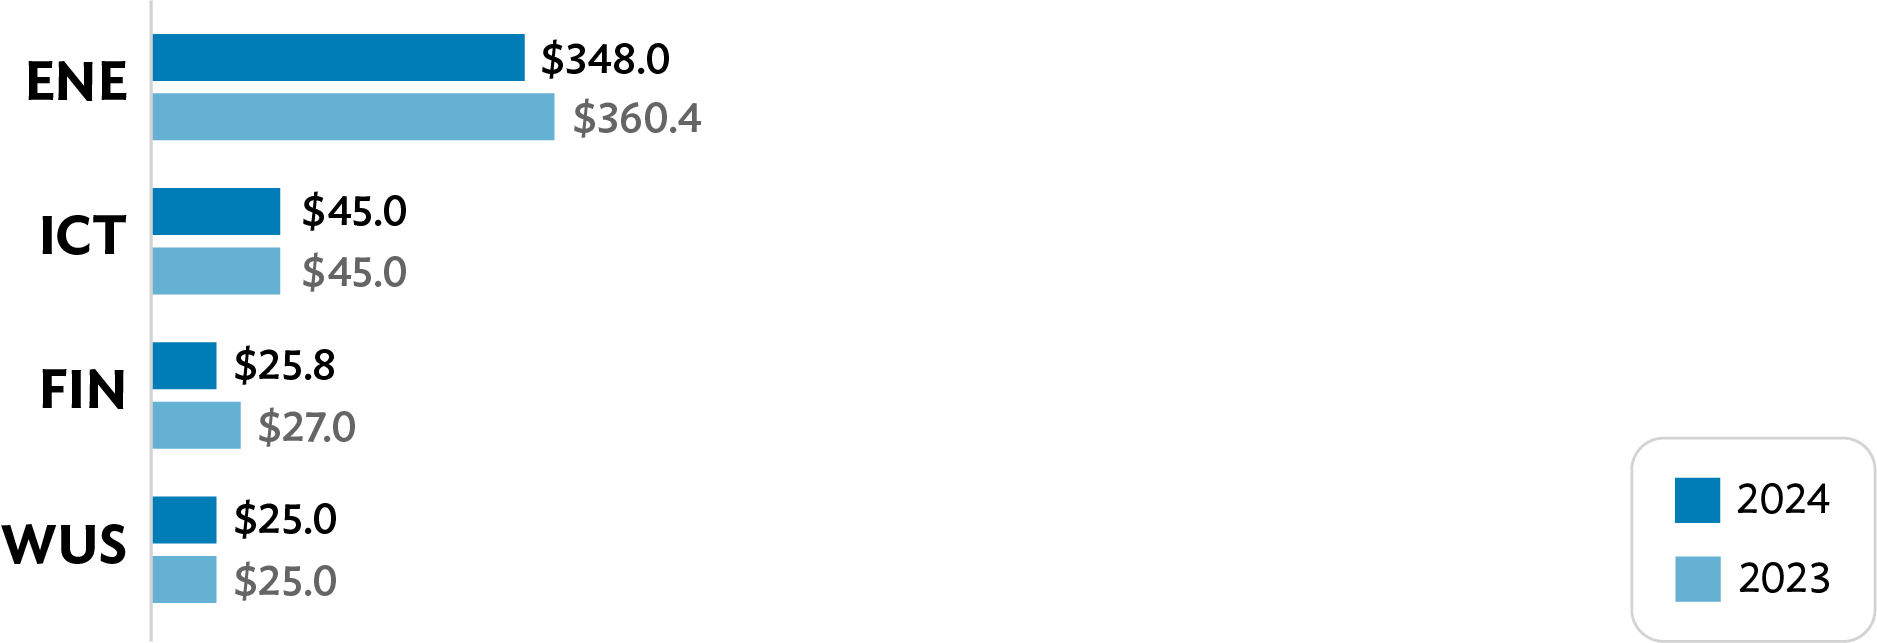
Sector breakdown. The FCAS and SIDS nonsovereign portfolio is distributed across energy ($348.0 million), information and communication technology ($45.0 million), finance ($25.8 million), and WUS ($25.0 million) (Figure 17). The volume of active commitments in the energy and finance sectors declined in 2024, while the WUS and information and communication technology sectors maintained their volumes.
Figure 17: FCAS and SIDS Nonsovereign Portfolio by Sector
(active committed projects and technical assistance as of 31 December 2024,
in $ million)

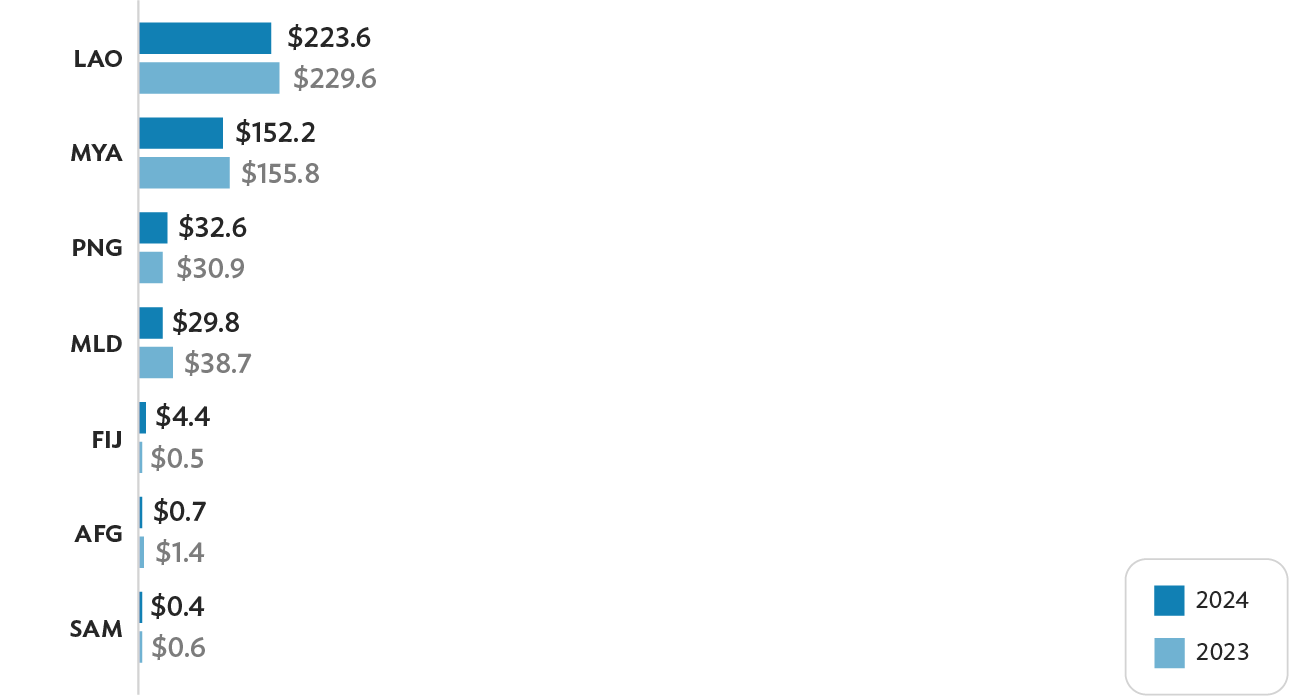
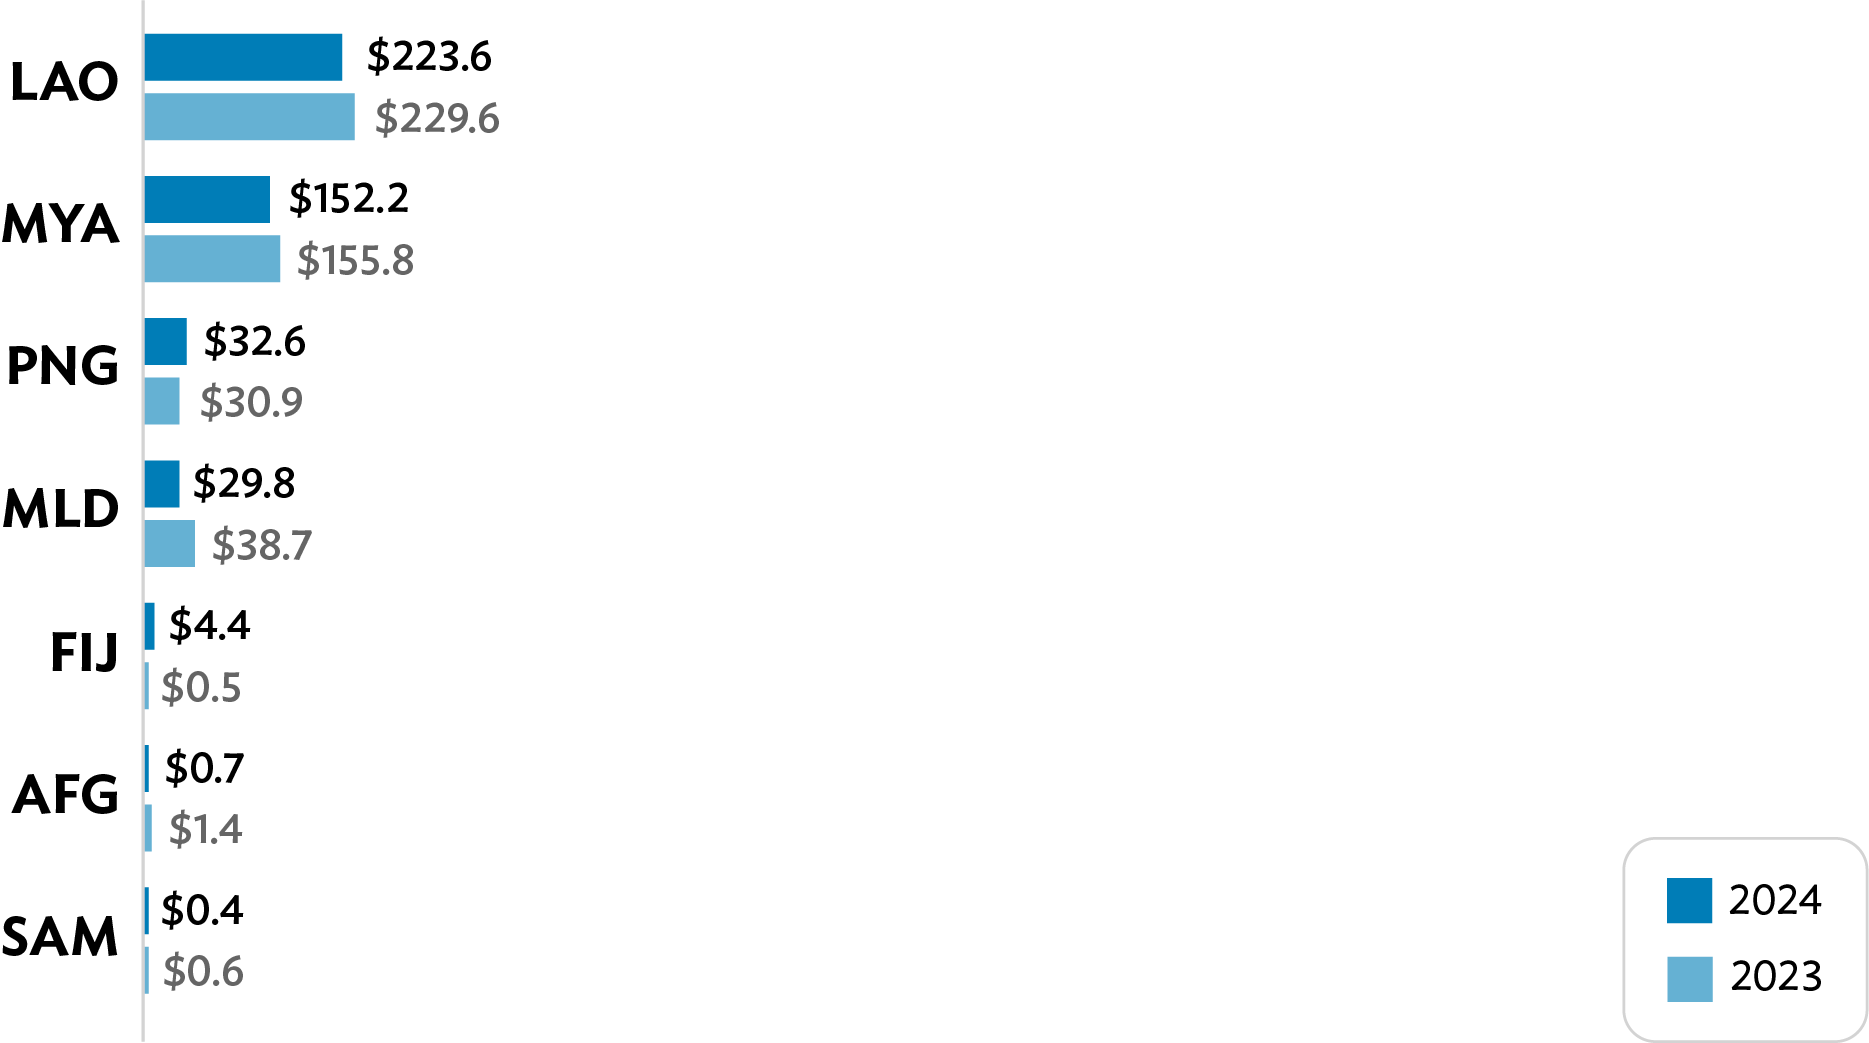
Country breakdown. Projects in the Lao PDR ($223.6 million), Myanmar ($152.2 million), PNG ($32.6 million), and Maldives ($29.8 million) comprised most of the 2024 FCAS and SIDS nonsovereign portfolio (Figure 18). Compared with 2023, the volume of the nonsovereign portfolio declined in all FCAS-classified DMCs and SIDS except Fiji and PNG.
Figure 18: FCAS and SIDS Nonsovereign Portfolio by Country
(active committed projects and technical assistance as of 31 December 2024,
in $ million)
Development Support
in FCAS and SIDS
ADB Frontier. Launched in 2023 to finance growing SMEs (gazelle SMEs) in frontier markets, the ADB Frontier platform established ADB Frontier Seed programs in the Pacific and Mekong regions in 2024. The Pacific program is initially focusing on Fiji and other selected Pacific island countries, while the Mekong program focuses on Cambodia and the Lao PDR. ADB’s Private Sector Operations Department implements these programs jointly with ADB’s Pacific Department and Southeast Asia Department. In the Pacific, initial transactions were made to SeaPac Pte. Ltd, a Fijian aquaculture company, to support increased commercialization of the nation’s prawn industry; and Kahuto Investments Pte. Ltd, an aerial mapping company in Fiji. In the Lao PDR, technical assistance during the project preparation phase of ADB Frontier was extended to Loca Co. Ltd. (Loca), a ride-sharing company that is building out electric mobility infrastructure; Forest Plateau Pte. Ltd. (Slow Coffee), a coffee producer and retailer selling to multinationals in Europe; and Greengoods Co. Ltd. (Green Company), poultry producer working with contract farmers from local communities.
These transactions help gazelle SMEs raise funds, increase market presence, and advance their business strategies. ADB Frontier aims to develop capital markets and build local industries in frontier markets. The approach is to target gazelle SMEs with good growth potential while boosting employment, empowering women, and supporting climate action. In the Lao PDR, Green Company has been able to increase the number of its contract farmers it works with from 55 to 330, while gaining export certification for its products, while Loca installed 40 fast-charging EV stations across the country in 2024.
Differentiated credit enhancement. ADB established the Wayfinder (Pacific) Program, a differentiated credit enhancement approach to accelerate nonsovereign operations in the Pacific and support sustainable private sector development. 29 The program comprises
- (i)
a lending and guarantee envelope of up to $80 million from ordinary capital resources (OCR);
- (ii)
grants and guarantees of up to $50 million from the ADF 14 private sector window;
- (iii)
technical assistance of up to $15 million from ADB’s Technical Assistance Special Fund on a noncost recovery basis;
- (iv)
concessional trust funds not exceeding $20 million; and
- (iv)
a major change in scope for the Microfinance Program to utilize up to $15 million of its existing $600 million limit to support micro, small, and medium-sized enterprises in the Pacific through partner financial institutions. 30
The program utilizes an innovative first-loss portfolio approach to credit enhancement, providing a meaningful risk mitigant for OCR exposures under Wayfinder, and also offers a more streamlined approach to project processing and endorsement. If successful in the Pacific, the aim is to extend the program to all DMCs eligible for the ADF Private Sector Window. 31
Read Our
Project Stories